
Image
|
Figure Caption
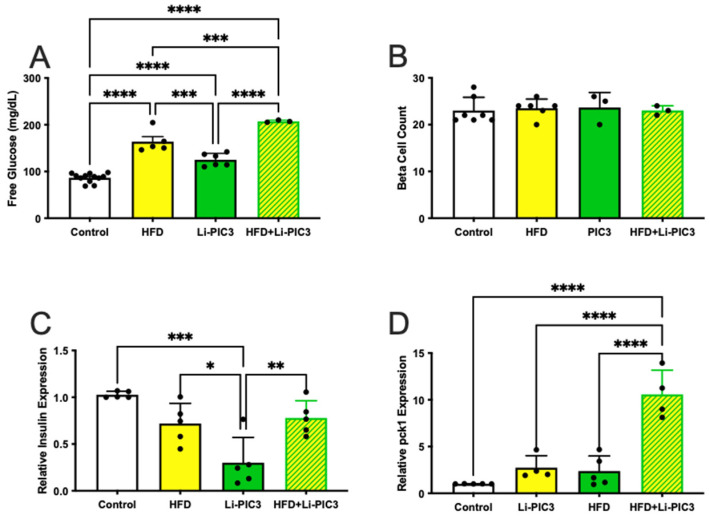
Figure 5
Hyperglycemia is induced without loss of β cells in HFD, Li-PIC3, and Li-PIC3+HFD larvae. (A) Blood glucose levels for Tg(fabp10:cre), HFD, Li-PIC3, and Li-PIC3+HFD larvae. (B) β cell count in Tg(fabp10:cre), HFD, Li-PIC3, and Li-PIC3+HFD larvae. (C) Transcript levels for insulin Tg(fabp10:cre), HFD, Li-PIC3, and Li-PIC3+HFD larvae. (D) Levels of pck1, a marker of gluconeogenesis, in Tg(fabp10:cre), HFD, Li-PIC3, and Li-PIC3+HFD larvae. Statistical analysis was by one-way ANOVA, n = 3–9; * p < 0.05, ** p < 0.01, *** p < 0.001, **** p < 0.0001.
Figure Data
Acknowledgments
This image is the copyrighted work of the attributed author or publisher, and
ZFIN has permission only to display this image to its users.
Additional permissions should be obtained from the applicable author or publisher of the image.
Full text @ Biomedicines