IMAGE

FIGURE 4

ID
ZDB-IMAGE-220319-33
Source
Figures for Stoyek et al., 2022
Image
Figure Caption

FIGURE 4

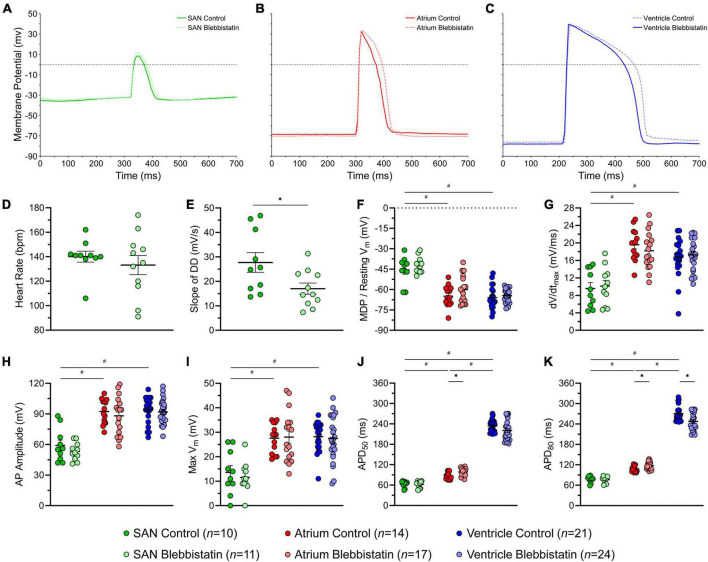
Effects of blebbistatin on the zebrafish sinoatrial node (SAN), atrial, and ventricular action potential (AP). Representative AP (A–C) and measured parameters (D–K) in the SAN (green), atrium (red), and ventricle (blue) with (dark) and without (light) blebbistatin (10 μM for 30 min). APD50 and APD80, AP duration at 50% and 80% repolarisation; DD, diastolic depolarisation; dV/dtmax, maximum rate of change of membrane potential during the AP upstroke; MDP, maximum diastolic potential; Vm, membrane potential. Data shown as mean ± SEM. SAN, atrium, and ventricle compared by unpaired, one-way ANOVA and Tukey post hoc tests; #p < 0.05. Control and blebbistatin compared by unpaired, two-tailed, Student’s t-tests; *p < 0.05. n indicates number of impalements, which were acquired in N = 6 hearts.

Acknowledgments
This image is the copyrighted work of the attributed author or publisher, and ZFIN has permission only to display this image to its users. Additional permissions should be obtained from the applicable author or publisher of the image. Full text @ Front. Physiol.