IMAGE

FIGURE 2

ID
ZDB-IMAGE-220319-31
Source
Figures for Stoyek et al., 2022
Image
Figure Caption

FIGURE 2

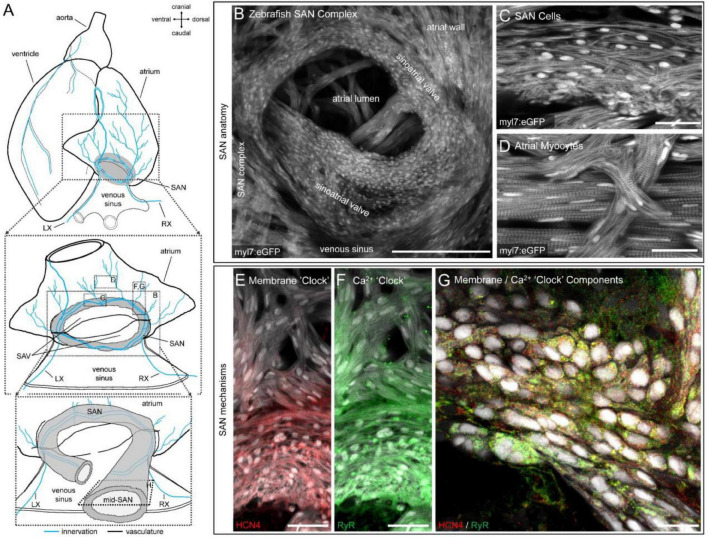
Structure and channel expression in the zebrafish sinoatrial node (SAN). Schematic of the zebrafish heart illustrating the location of the images in B-H (A). Overview of the zebrafish SAN complex visualised by eGFP fluorescence in myl7-expressing cardiomyocytes (B). Morphology of SAN cells (C) and atrial myocytes (D) in a 5 μm confocal z-projection. Immunofluorescence of hyperpolarisation-activated cyclic nucleotide-gated channel-4 (HCN4, red; E) and ryanodine receptor (RyR, green; F) expression in a 50 μm confocal z-projection through the SAN and proximal atrial myocardium. Cellular distribution of RyR and HCN4 in a single optical plane from approximately the mid-SAN (G). Scale bars (in μm): (B): 200 μm; (C,D): 25 μm; (E,F): 40 μm; (G): 25 μm. LX, left cardiac branch of the vagal nerve; RX, right cardiac branch of the vagal nerves; SAV, sinoatrial valve.

Acknowledgments
This image is the copyrighted work of the attributed author or publisher, and ZFIN has permission only to display this image to its users. Additional permissions should be obtained from the applicable author or publisher of the image. Full text @ Front. Physiol.