IMAGE

FIGURE 1

ID
ZDB-IMAGE-220319-30
Source
Figures for Stoyek et al., 2022
Image
Figure Caption

FIGURE 1

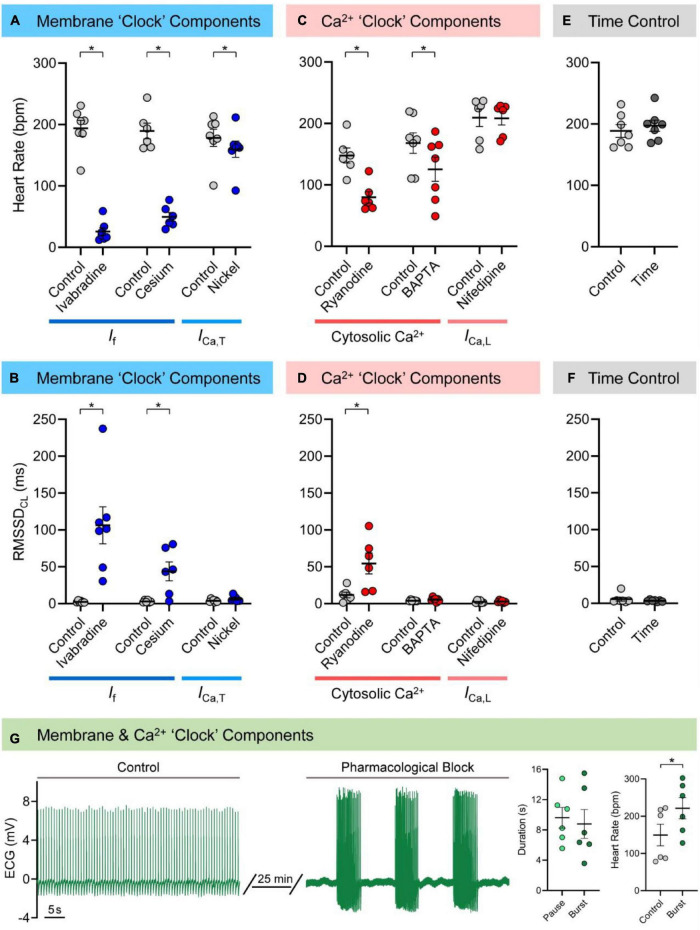
Mechanisms of zebrafish sinoatrial node (SAN) automaticity. Effects of pharmacological block of membrane (40 min of 3 μM ivabradine hydrochloride for intracellular block of “funny” current, If, n = 7; 7 min of 3 mM cesium chloride for extracellular block of If, n = 6; 15 min of 165 μM nickel(II) chloride for block of T-type Ca2+ current, ICa,T, n = 7) or Ca2+ (15 min of 1 μM ryanodine for block of ryanodine receptors, n = 6; 30 min exposure of 5 μM BAPTA-AM, followed by 30 min to allow for de-esterification of the AM group, for chelation of cytosolic Ca2+, n = 7; 15 min of 0.2 μM nifedipine for block of L-type Ca2+ current, ICa,L, n = 6) “clock” components, as well as matched time controls (60 min, n = 7) on heart rate (A,C,E) and the inter-beat variability of cycle length (measured as the root mean square of its successive differences, RMSSDCL; B,D,F), in the isolated zebrafish heart. Representative electrocardiogram (ECG) recording of zebrafish cardiac rhythm in control and after combined pharmacological block of membrane and Ca2+ “clock” components (3 mM cesium chloride, 165 μM nickel(II) chloride, and 1 μM ryanodine, n = 6) and measurements of the resulting SAN pause and burst duration and control and burst heart rate (G). Data shown as mean ± SEM. Means compared by paired, two-tailed, Student’s t-tests; *p < 0.05.

Acknowledgments
This image is the copyrighted work of the attributed author or publisher, and ZFIN has permission only to display this image to its users. Additional permissions should be obtained from the applicable author or publisher of the image. Full text @ Front. Physiol.