IMAGE

FIGURE 5

ID
ZDB-IMAGE-220316-38
Source
Figures for Messerschmidt et al., 2022
Image
Figure Caption

FIGURE 5

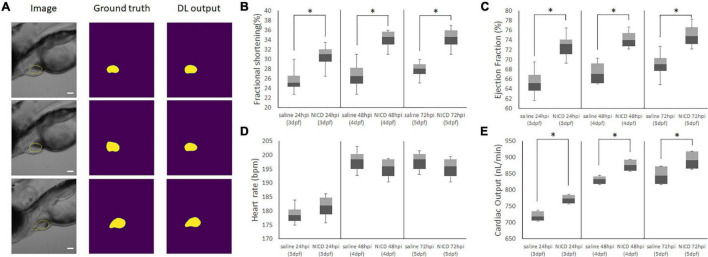
Representative Images of Model Output for analyzing cardiac functions. (A) Representative images of the image input (column 1), hand segmented cardiac volume (column 2), and the model’s predicted cardiac volume after training the ZACAF network (column 3). (B,C) FS and EF comparisons demonstrated the zebrafish heart contracts stronger after injecting NICD incorporated PLGA nanoparticles. (D) Injection of NICD loaded PLGA nanoparticles didn’t affect heart rate. (E) Cardiac output of both control group and NICD loaded nanoparticles gradually increased as zebrafish heart matures. However, nanoparticles injected zebrafish has higher number of cardiac output. * indicates a significant difference (p < 0.01). n = 250 zebrafish images per group.

Acknowledgments
This image is the copyrighted work of the attributed author or publisher, and ZFIN has permission only to display this image to its users. Additional permissions should be obtained from the applicable author or publisher of the image. Full text @ Front. Physiol.