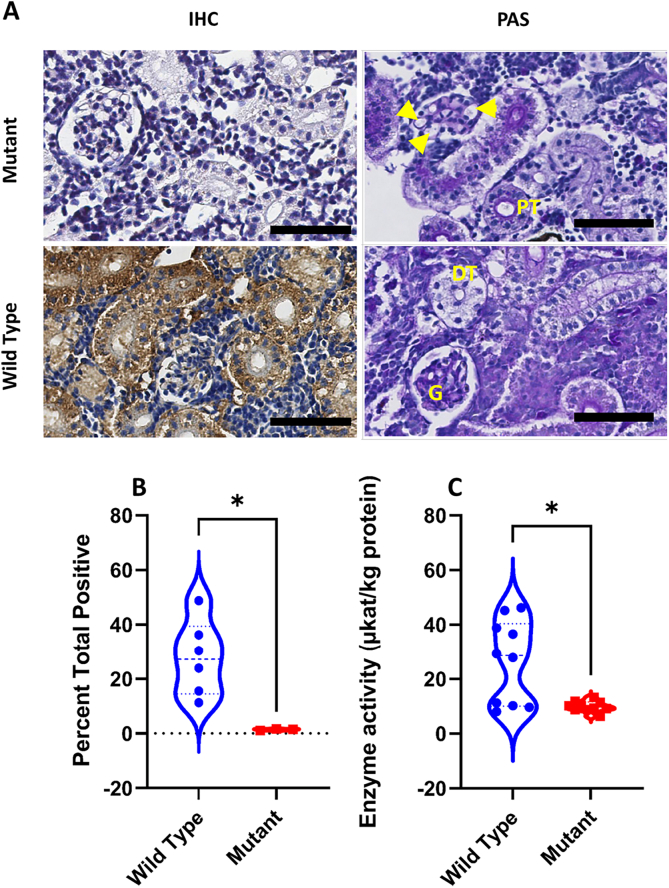
IMAGE

Fig. 4

ID
ZDB-IMAGE-220306-8
Genes
Antibodies
Source
Figures for Elsaid et al., 2022
Image
Figure Caption

Fig. 4

Histological distribution and enzymatic activity of Zebrafish- α-GAL protein in the GLA mutant zebrafish. (A) Scanned digital images show α-GAL antibody and periodic acid Schiff staining. Note that PAS staining shows dilated capillary loops and thinner Bowman's space (yellow arrowheads) in mutant compared to wild type animals. (B) Quantification of immunohistochemical analysis of sections from wild-type and mutant kidneys. Signal intensity is significantly higher in wild type compared to mutant tissues (Mann-Whitney U test: P < 0.05). The violin plot represents these results within the 95th percentile, and the dash-line symbol inside the violin plot represents the median. Scale bar = 50um. (C) Comparison of α-GAL activity in wild type and mutant zebrafish kidney tissue lysate (Mann-Whitney Test, P < 0.05).

Figure Data
Acknowledgments
This image is the copyrighted work of the attributed author or publisher, and ZFIN has permission only to display this image to its users. Additional permissions should be obtained from the applicable author or publisher of the image. Full text @ Mol Genet Metab Rep