IMAGE

Figure 5

ID
ZDB-IMAGE-220213-22
Source
Figures for Swain et al., 2022
Image
Figure Caption

Figure 5

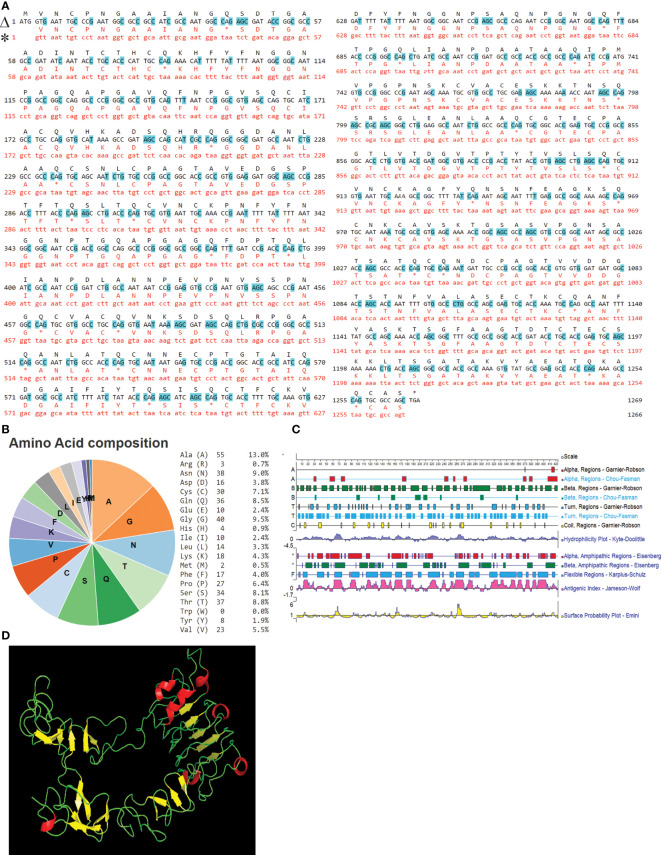
IAG52B sequence analysis. (A) Alignment of nucleotide and amino acid sequences of the original and codon-optimized IAG52B gene. Line marked with Δ is the codon optimized sequence and * is the original IAG52B sequence. Changed nucleotide sequences are highlighted with blue. (B) Pie chart and table illustrates the amino acid composition of IAG52B. (C) The secondary structures of IAG52B protein were predicted by Protean software by using Gramier-Robson and Chou-Fasman methods. Lines 1, 3, 5, and 7 are the Gramier -Robson methods; the red represents the alpha helix, the green represents the beta fold, the blue represents the turn, the yellow represents the random coil. Lines 2, 4, 6 are for the Chou -Fasman method; the red represents the alpha helix, the green represents the beta fold, the blue for the turn, without random coil prediction. (D) The 3D structure of IAG52B protein was predicted using the Phyre2 web portal.

Acknowledgments
This image is the copyrighted work of the attributed author or publisher, and ZFIN has permission only to display this image to its users. Additional permissions should be obtained from the applicable author or publisher of the image. Full text @ Front Immunol