
|
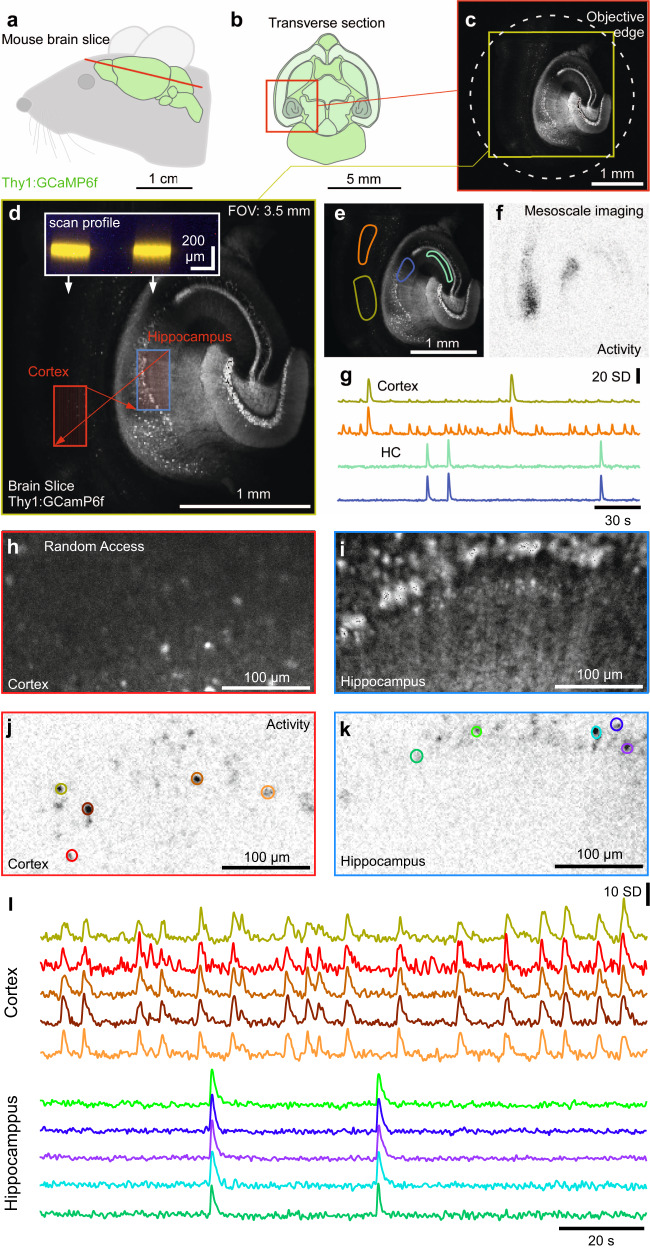
Fig. 8
a, b Schematic of brain (a) and transverse section (b) of a Thy1:GCaMP6f mouse. c, d 1024 × 1024 px nTC2 example scan of slice through cortex and hippocampus at maximal FOV (c) and nTC2 zoom in (d) as indicated. Red arrows indicate rapid transitions between scan regions, with the inset showing scan-profiles. The slice was bathed in an epileptogenic (high K+, zero Mg2+) solution to elicit seizures. e–g Mean of 256 × 256 px scan (3.91 Hz) of (d) with regions of interest (ROIs) indicated (e), activity-correlation projection (Methods) indicating regions within the scan showing regions of activity computed as mean correlation of each pixel’s activity over time to all its neighbours (for details, see ref. 70) (f) and z-normalised fluorescence traces (g). h–l, 2 times 128 × 256 px (3.91 Hz) random access scan of two regions as indicated in (d) allows quasi-simultaneous imaging of the cortex (h) and hippocampus (i) at increased spatial resolution, with activity-correlation (j, k, cf. Fig. 3c) and fluorescence traces (l) extracted as in (j, k).