IMAGE

Figure 2

ID
ZDB-IMAGE-211219-54
Source
Figures for Bartel et al., 2021
Image
Figure Caption

Figure 2

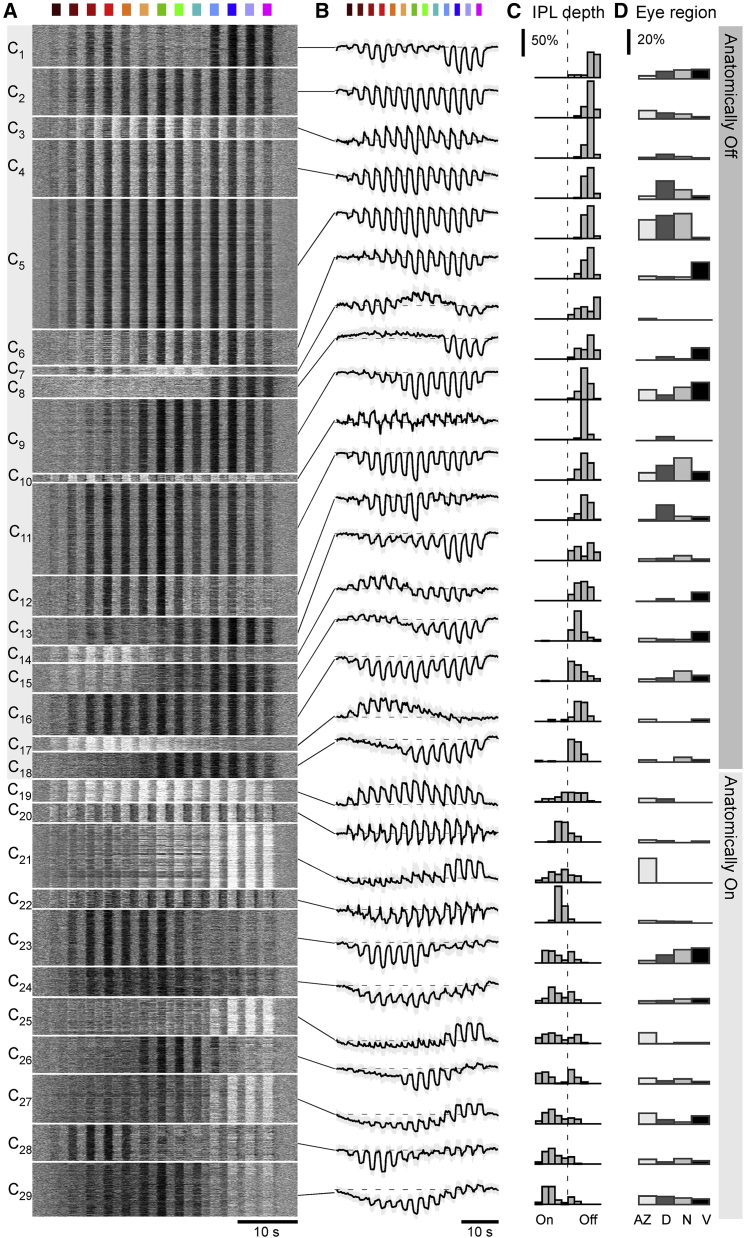
Clustering into 29 functional BC types

Overview of the result from unsupervised clustering of all BC data recorded as shown in Figure 1 that passed a minimum quality index (QI) (QI > 0.4; STAR Methods). For each cluster, shown are the individual BC mean responses as heatmaps (A); the corresponding cluster means and SD shadings, with approximate baseline indicated in dashed (B); distribution of ROI positions in the IPL (C); and each cluster’s distribution across the four recording regions within the eye (D, from left: acute zone; dorsal; nasal; and ventral). Histograms in (C) are area normalized by cluster and in (D) by recording region. Clusters are ordered by their average anatomical position in the IPL, starting from the border with the inner nuclear layer (cf. C). The colored symbols indicate the overall spectral group as assigned later (cf. Figures 5F–5K).

Acknowledgments
This image is the copyrighted work of the attributed author or publisher, and ZFIN has permission only to display this image to its users. Additional permissions should be obtained from the applicable author or publisher of the image. Full text @ Curr. Biol.