
|
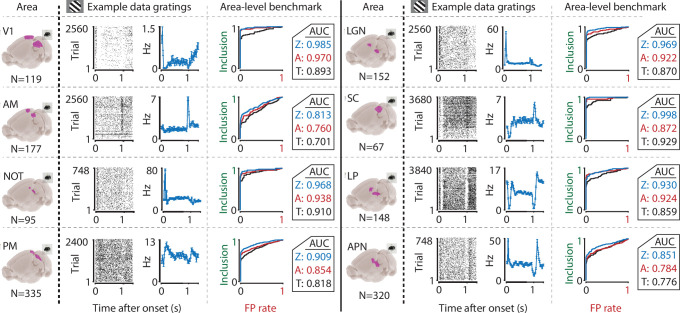
Figure 3
We recorded neuronal responses to drifting gratings (1 s with 500 ms blank ITIs) from various visual brain areas: V1, SC, AM, LP, NOT, APN, PM, and LGN. For each area, we show an example neuron’s raster plot (left) and binned responses (right). All cells depicted here were significant using ZETA. Area-level benchmark summaries show ROC analyses of the inclusion rate (y-axis) and false-positive (FP) rate (x-axis) for ZETA (Z, blue), bin-wise ANOVA (A, red), and rate-based t-tests (T, black). In all cases, the AUC of the ZETA-test exceeded both the ANOVA’s AUC and t-test’s AUC.
The ZETA-test’s superior sensitivity is independent of brain area.