
|
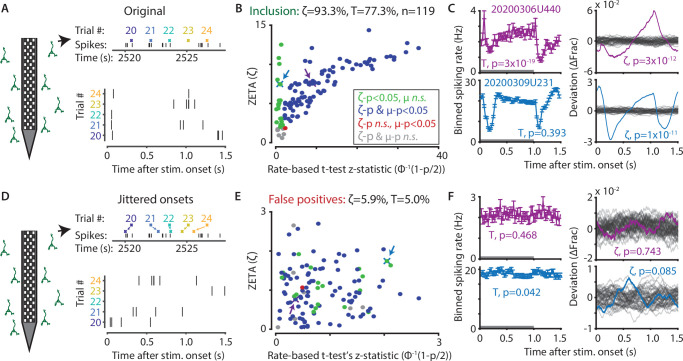
Figure 2
(A) Spikes were recorded with neuropixels in mouse V1 and aligned with the onset of square-wave drifting gratings. (B) Applying the ZETA-test, we found that 93.3 % of all V1 neurons showed significant firing rate modulations that were time-locked to stimulus onset. Using a rate-based t-test between stimulation (0–1 s) and no stimulation (1–1.5 s) epochs across trials registered 77.3 % of neurons to be visually responsive. Neurons detected by only ZETA are green, by both methods are blue, by only a mean-rate t-test are red, and by neither are grey. Arrows indicate the neurons shown in C. (C) Two example neurons that are (1) detected by a rate-based t-test as well as ZETA (top) and (2) not detected by a rate-based t-test, but only by ZETA (bottom). (D) We investigated the false-positive rate of both approaches by jittering the onsets of visual stimuli; this preserved the temporal structure of the spiking response, but destroys the time-locked modulations in activity. (E–F) same cells and analyses as in B-C but for jittered onsets. Red indicates neurons included by ZETA, but not a t-test; green indicates neurons included by a t-test, but not ZETA. As expected, the percentage of false positives (i.e., neurons with ζc/z-statistic > 2.0) was around 5 % (α = 0.05) for both approaches. Note the change in axis magnitude from B to E.
The ZETA-test outperforms the t-test for V1 neurons (n = 119).