IMAGE

Figure 2

ID
ZDB-IMAGE-211201-130
Source
Figures for An et al., 2021
Image
Figure Caption

Figure 2

A representative frozen section (× 200, hematoxylin and eosin)
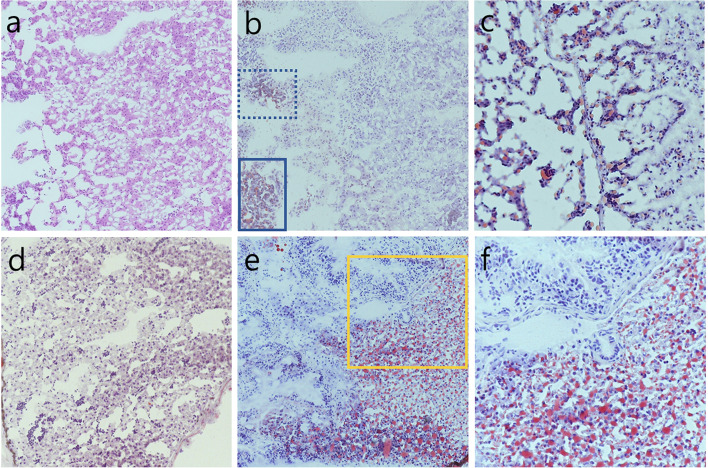
 (a) of a liver was obtained from zebrafish No. 5 (low fatty liver group) and stained with oil red O. In the same area of Fig. 1a, a 10% fatty change was observed with oil red O positive stain (box) (× 200) (b). Higher magnification of the oil red O positive area (lower box marked with solid line in Fig. 1b) (× 400) (c). A representative section of oil red O stain from the zebrafish before feeding a high cholesterol diet (× 200) (d) (see the workflow diagram of Fig. 1). The high fatty liver group contains zebrafish that have a proportion score of no less than 50 (× 200) (e). At higher magnification (yellow box in Fig. 1e), both macrovesicular and microvesicular fatty changes were detected at high levels in the high fatty liver group compared to the negative internal control of the glandular epithelial cells in the stomach (left upper side) (× 400) (f).

Acknowledgments
This image is the copyrighted work of the attributed author or publisher, and ZFIN has permission only to display this image to its users. Additional permissions should be obtained from the applicable author or publisher of the image. Full text @ Sci. Rep.