
|
Figure 2.
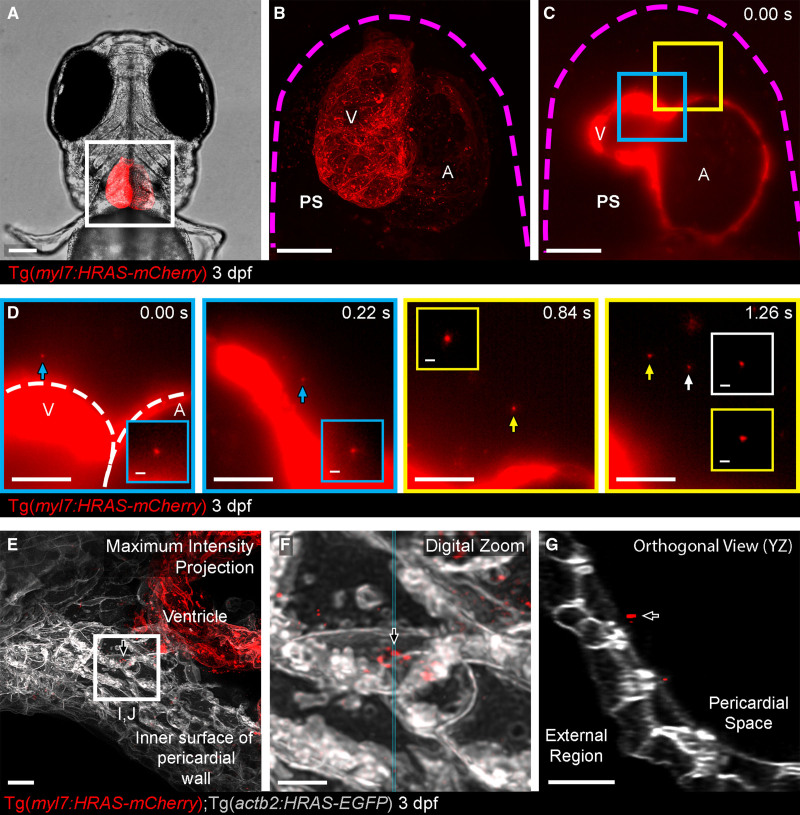
Figure 2. Cell-type specific extracellular vesicle (EV) labeling strategy and live imaging in the pericardial space (PS).A, Ventral view of 3 dpf Tg(myl7:HRAS-mCherry) zebrafish, boxed region highlights position of B and C. B and C, Overview images of the entire hearts of Tg(myl7:HRAS-mCherry) fish in ventral view. B, A maximum projection of a fixed fish; (C) a single plane of live light sheet imaging. D, Image sequences of higher magnification views of the color coded boxed areas in C. mCherry+ CM-EVs are observed moving through the pericardial space (arrowed and inset). E–G, A maximum intensity projection of deconvolved images of the ventricle and internal surface of the pericardial wall (E) reveals static CM-EVs as shown with digital zoom of boxed region (F). The orthogonal view (YZ) of this region suggests the EVs may be associated with a layer of unmarked ECM (extracellular matrix) rather than direct contact with underlying cells (G). The magenta dashed line in B and C demarks the pericardial wall. The white dashed line in D demarks the ventricle (V) and atrium (A). Arrows indicate static EVs. Anterior is to the left. Scale bars: A, 100 μm; B and C, 50 μm; D, 20 μm; insets in D, 2 μm; E and G, 5 μm; F, 2 μm.