
Fig. 2.
- ID
- ZDB-IMAGE-210807-2
- Publication
- Murphy et al., 2021 - Exercise, programmed cell death and exhaustion of cardiomyocyte proliferation in aging zebrafish
- All Figures
- Figures for Murphy et al., 2021
|
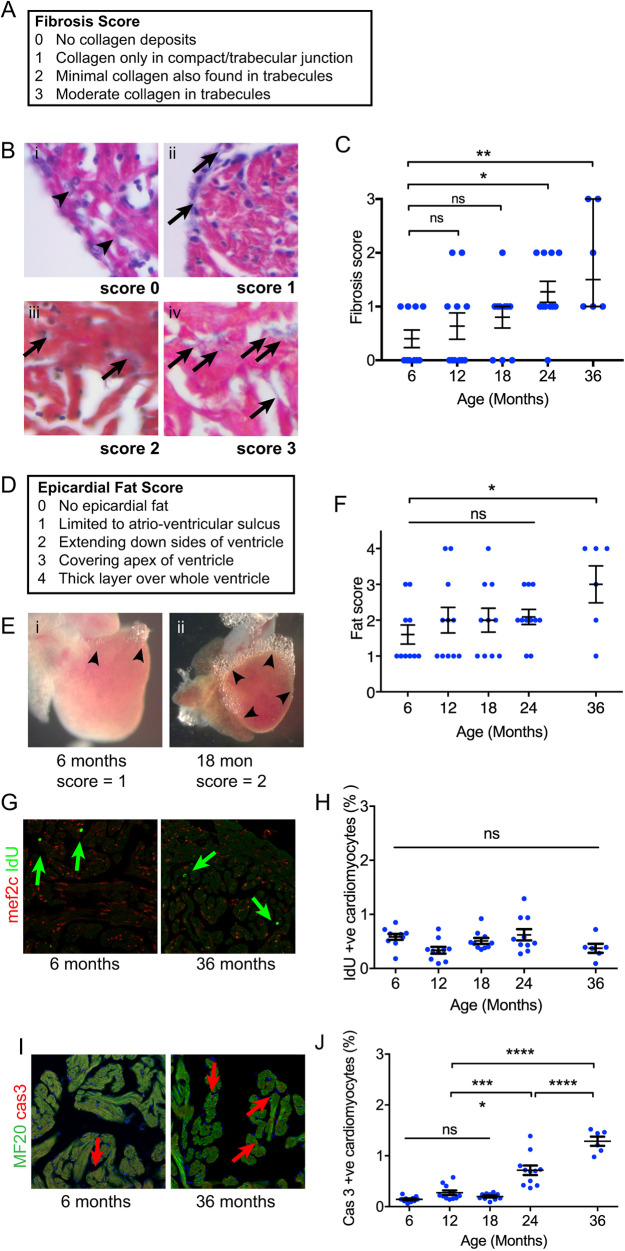
Fig. 2. (A) Description of semiquantitative fibrosis score. (B) Appearances of each fibrosis score category. Arrowheads (i) indicate the absence of collagen at the compact-trabecular junction. Arrows indicate deposits of fibrosis at the compact-trabecular junction (ii) and in the trabecular myocardium (iii and iv). (C) Fibrosis score with age. Sample size (n) was 10, 11, 10, 11 and 6 for age groups 6, 12, 18, 24 and 36 months, respectively. All individual data points are shown with median and quartiles. The median fibrosis score was elevated at 24 and 36 months (Kruskal–Wallis test, non-parametric ANOVA). (D) Description of semiquantitative epicardial fat score. (E) Epicardial fat limited to the atrioventricular sulcus (i) and extending over sides (ii). (F) Increased epicardial fat score at 36 months (one-way ANOVA). Sample size (n) was 10, 11, 10, 11 and 6 for age groups 6, 12, 18, 24 and 36 months, respectively. (G) Examples of immunofluorescence labelling of IdU incorporation (arrows) at 6 and 36 months. (H) Percentage of cardiomyocytes incorporating IdU remains constant with age. Sample size (n) was 10, 10, 10, 10 and 6 for age groups 6, 12, 18, 24 and 36 months, respectively. (I) Nuclei labelling with activated caspase 3 antibodies (arrows). (J) Increased frequency of caspase+ cardiomyocyte nuclei from 24 months of age (one-way ANOVA). Sample size (n) was 10, 11, 10, 11 and 6 for age groups 6, 12, 18, 24 and 36 months, respectively. All individual data points are shown. Data are mean±s.e.m. *P<0.05; **P<0.02; ***P<0.001; ****P<0.0001; ns, not significant.