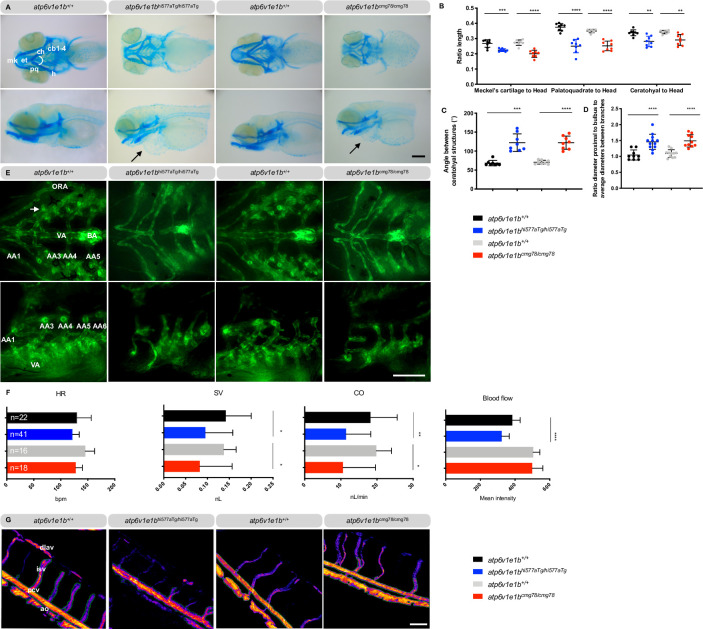
IMAGE

Fig 1

ID
ZDB-IMAGE-210714-25
Source
Figures for Pottie et al., 2021
Image
Figure Caption

Fig 1 <italic toggle='yes'>Atp6v1e1b</italic>-deficient zebrafish have craniofacial, vascular and cardiac abnormalities reminiscent of the human <italic toggle='yes'>ATP6V1E1</italic>-related CL phenotype.

Representative images are shown. (A) Ventral (top panel) and lateral views (bottom panel) of Alcian blue stained craniofacial structures at 5 dpf reveal misshapen and shorter Meckel’s cartilage (m), shorter palatoquadrate (pq) and shorter ceratohyal (ch) structure and a higher angle between ch structures in atp6v1e1b-deficient zebrafish. Pericardial edema is indicated by an arrow. (B) The length of the individual cartilage structures was measured and normalized to the head length of the larvae. (C) Quantification of the angle between the ceratohyal structures. (D) Ratio of the aortic diameter proximal to the bulbus arteriosus (BA) to the average aortic diameter between the first (AA3) and the second branchial arch (AA4) as a measure of local dilatation. (E) Ventral (top panel) and lateral views (bottom panel) of the cardiovascular structure of atp6v1e1b-deficient zebrafish in the Tg(kdrl:eGFP) background at 5 dpf. (F) Cardiac parameter analysis based on brightfield microscopy recordings at 3 dpf. (G) Pseudo-colored processed images representing relative blood flow intensity in the trunk of 3 dpf zebrafish. Major blood vessel ROI used for quantification is marked with a green outline. Data are expressed as mean ± standard deviation (SD). AA1: mandibular arch; AA3: first branchial arch; AA4: second branchial arch; AA5: third branchial arch; AA6: fourth branchial arch; Ao: aorta; BA: bulbus arteriosus; cb1-4: ceratobranchial pairs 1 to 4; ch: ceratohyal; CO: cardiac output; dlav: dorsal longitudinal anastomotic vessel; et: ethmoid plate; h: hyosymplectic; HR: heart rate; isv: intersegmental vessel; m: Meckel’s cartilage; ORA: opercular artery; pcv: posterior caudal vein; pq, palatoquadrate; SV: stroke volume; VA: ventral aorta. Scale bar = 200 μm (A), scale bar = 100 μm (E and G).

Acknowledgments
This image is the copyrighted work of the attributed author or publisher, and ZFIN has permission only to display this image to its users. Additional permissions should be obtained from the applicable author or publisher of the image. Full text @ PLoS Genet.