
|
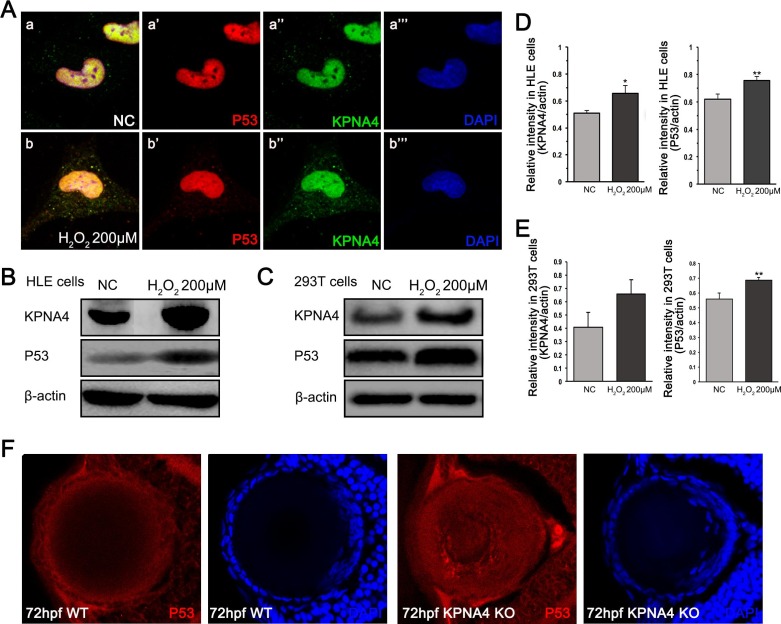
Fig. 5 The expression pattern of p53 in H2O2-induced apoptotic cells and kpna4 knockout zebrafish. (A) HLE cells stained for KPNA4 (green) and p53 (red) in the normal control (NC) group or 200 μmol/L H2O2 treatment. (B-C) Western blot with KPNA4 and p53 in the NC and 200 μmol/L H2O2 treatment group in HLE cells or 293 T cells. (D-E) The relative intensity of KPNA4/actin and p53/actin of three independent experiments in HLE cells or 293 T cells. (F) Immunofluorescence for p53 in the lens of 72 hpf WT and kpna4 knockout zebrafish. (For interpretation of the references to colour in this figure legend, the reader is referred to the web version of this article.)
Reprinted from Gene, 786, Ping, X., Cheng, Y., Bao, J., Shi, K., Zou, J., Shentu, X., KPNA4 is involved in cataract formation via the nuclear import of p53, 145621, Copyright (2021) with permission from Elsevier. Full text @ Gene