IMAGE

Fig 7

ID
ZDB-IMAGE-210422-20
Source
Figures for Sutton et al., 2021
Image
Figure Caption

Fig 7 Role of putative glucosaminidases in <italic>S</italic>. <italic xmlns:xlink='http://www.w3.org/1999/xlink'>aureus</italic> growth and virulence.

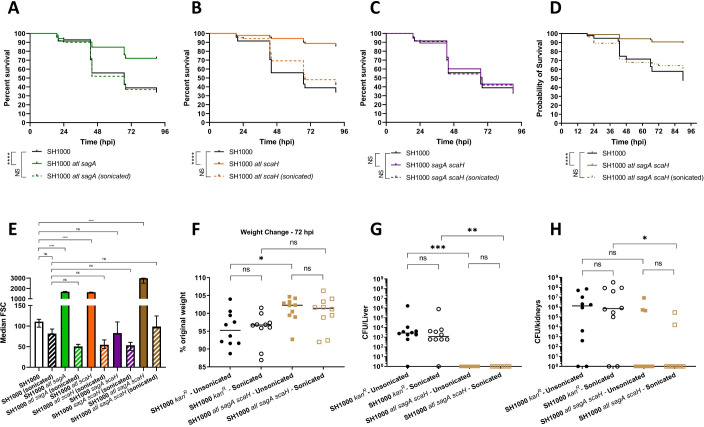
Survival curves comparing the virulence of 1300 CFU parental NewHG (SJF 3663, black lines) to (A) 400 particles unsonicated SH1000 atl sagA (SJF 5261, solid green line) consisting of 1300 bacteria (when sonicated) or approximately 1300 CFU of sonicated SH1000 atl sagA (broken green line). (B) 300 particles of unsonicated SH1000 atl scaH (SJF 5262, solid orange line) consisting of 1300 bacteria (after sonication) or 1300 CFU sonicated SH1000 atl scaH (broken orange line). (C) 1300 CFU unsonicated SH1000 sagA scaH (SJF 5217, solid purple line, sonication did not change CFU) or 1300 CFU sonicated SH1000 sagA scaH. (D) 100 particles of unsonicated SH1000 atl sagA scaH (consisting of 1500 bacteria, solid brown line), 1500 CFU of sonicated SH1000 atl sagA scaH (broken brown line). (A-D each consist of 3 repeats, n>20, **** p < 0.0001). (E) Comparison of the median FSC light values of parental SH1000 (unsonicated white bar, sonicated black and white bar), SH1000 atl sagA (unsonicated green bar, sonicated green and white bar), SH1000 atl scaH (unsonicated orange bar, sonicated orange and white bar) SH1000 sagA scaH (unsonicated purple bar, sonicated purple and white bar) and SH1000 atl sagA scaH (unsonicated brown bar, sonicated brown and purple bar). (n = 3, **** p < 0.0001). Error bars show ±SD, FSC values were compared using a one-way ANOVA with Dunnet’s multiple comparison test. (F-G)S. aureus SH1000 kanR (SJF 3674) or SH1000 atl sagA scaH (SJF 4611) were injected intravenously into mice (n = 10). Approximately 1 x 10⁷ bacteria were injected in unsonicated and sonicated groups. 1 x 10⁷ bacteria in 5 x 10⁶ particles of unsonicated SH1000 atl sagA scaH was injected (sonication had no effect on SH1000 kanR). (F) Weight loss 72 hpi (* p = 0.0314), (G) liver CFU (** p = 0.0014, *** p = 0.0003) and (H) kidney CFU (** p = 0.0096) were determined. Groups were compared using a Kruskal-Wallis test with multiple comparisons (Unsonicated SH1000 kanR–black circles, sonicated SH1000 kanR–open black circles, unsonicated SH1000 atl sagA scaH—brown squares and sonicated SH1000 atl sagA scaH–open brown squares). Sonication was for 20 seconds at an amplitude of 5 microns when required.

Acknowledgments
This image is the copyrighted work of the attributed author or publisher, and ZFIN has permission only to display this image to its users. Additional permissions should be obtained from the applicable author or publisher of the image. Full text @ PLoS Pathog.