
|
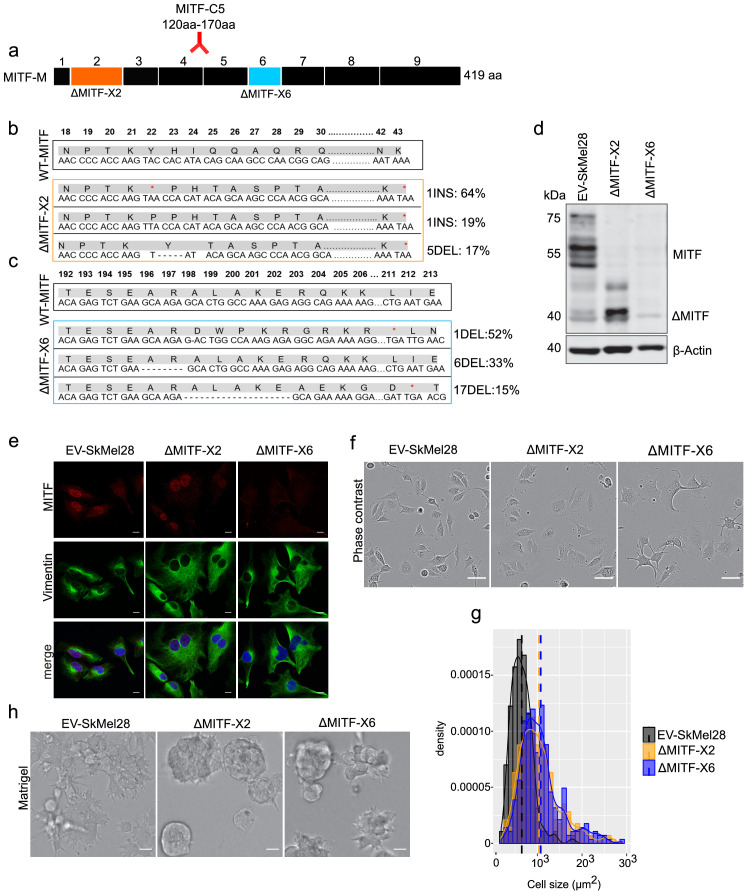
Figure 1 MITF depletion affects cell size and cell-matrix interaction. (a) Schematic illustration of MITF-M isoform and gRNA targeted location at exon 2 and exon 6. The epitope location for MITF C5 antibody spanning exons 4 and 5 is shown. (b, c) Mutations detected in ∆MITF-X2 and ∆MITF-X6 cell lines; amino acid sequence numbering was indexed relative to MITF-M. Percentage of mutations was derived from WGS analysis by counting sequenced fragments aligned to the mutated regions. (d) Western blot showing the MITF band in EV-SkMel28, ∆MITF-X2, and ∆MITF-X6 cell lines. (e) Immunostaining for MITF and Vimentin in EV-SkMel28, ∆MITF-X2, and ∆MITF-X6 cell lines, scale bar (10 µm). (f, g) Phase-contrast microscopy and cell size quantification using Image J with at least 200 images taken for both MITF-KO and EV-SkMel28 cell lines, scale bar (10 µm). Average cell size for each cell line is indicated by dashed lines; EV-SkMel28 cells (6502 µm2, SEM: 460), ΔMITF-X2 (10,395 µm2, SEM: 270) and the ΔMITF-X6 (10,825 µm2, SEM: 330). (h) Bright-field images of MITF-KO and EV-SkMel28 cells grown on top of matrigel, scale bar (10 µm).