
Image
|
Figure Caption
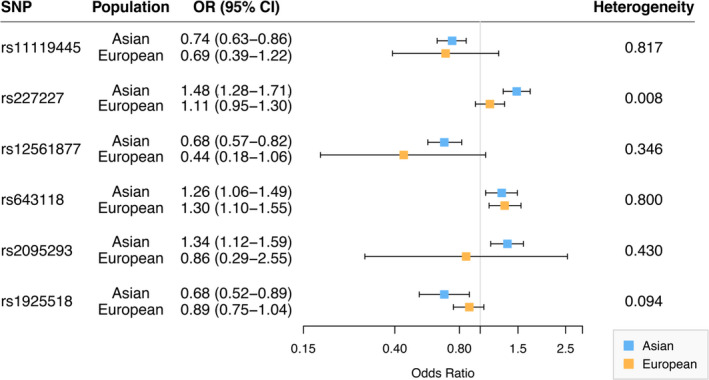
Figure 3
Comparison of associations for the six genetic variants in Asian and European ancestry populations.
Acknowledgments
This image is the copyrighted work of the attributed author or publisher, and
ZFIN has permission only to display this image to its users.
Additional permissions should be obtained from the applicable author or publisher of the image.
Full text @ J. Cell. Mol. Med.