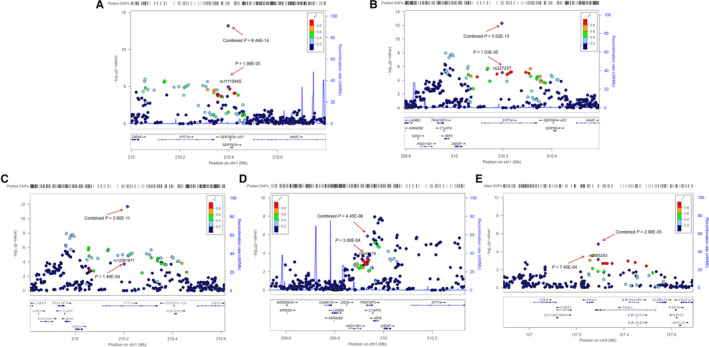
IMAGE

Figure 2

ID
ZDB-IMAGE-201229-5
Source
Figures for Ma et al., 2020
Image
Figure Caption

Figure 2

Regional plot of the five newly identified SNPs. The regional plots indicate five variants (A) rs11119445, (B) rs227227, (C) rs12561877, (D) rs643118 and (E) rs2095293 and linkage disequilibrium structure. Logistic regression analyses were used to test the genetic association under an additive model. The marker SNPs are shown as purple diamonds with P values in primary GWAS meta and as with their P values in the combined stage when all of the NSCL/P cases and controls from the primary GWAS meta and replication I, II were pooled together. Points are colour‐coded based on linkage disequilibrium (r2) in Asians. For each plot, the recombination rates (right y‐axes) of the region are shown according to their chromosomal positions (x‐axis)

Acknowledgments
This image is the copyrighted work of the attributed author or publisher, and ZFIN has permission only to display this image to its users. Additional permissions should be obtained from the applicable author or publisher of the image. Full text @ J. Cell. Mol. Med.