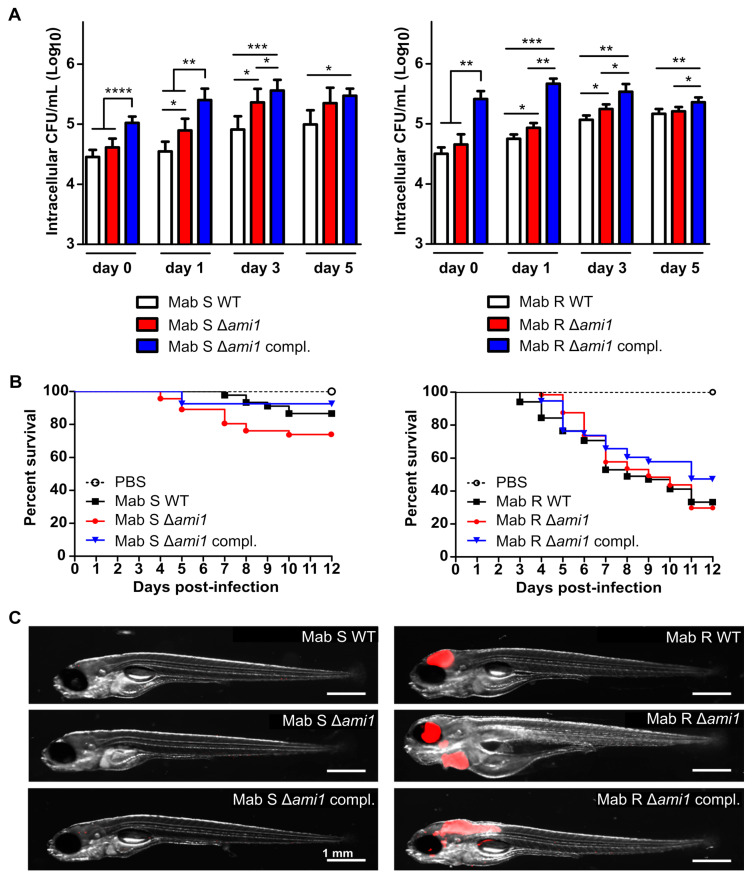
IMAGE

Figure 2

ID
ZDB-IMAGE-201130-68
Source
Figures for Küssau et al., 2020
Image
Figure Caption

Figure 2

Assessment of Δami1Mab in human macrophage and zebrafish larvae. (A) M. abscessus-infected THP-1 macrophages with amikacin maintained at 50 μg/mL in the RPMI medium were lysed from day 0 to day 5 for CFU enumeration. Bacteria were plated at day 0 (2–4 h phagocytosis followed by a 2 h amikacin treatment at 250 μg/mL) day 1, 3 and day 5. Histograms and error bars represent means and standard deviations calculated from three independent experiments. For statistical analysis, the unpaired t-test with Welch’s correction was applied. *, **, ***, and **** stand for p < 0.1, p < 0.01, p < 0.001, and p < 0.0001, respectively. Left and right panels are for M. abscessus S and R variants, respectively. The M. abscessus S and R wild-type strains used as controls were not transformed with pMV306. (B) Survival curves of zebrafish embryos infected with the different M. abscessus strains. The data shown are corresponding to a pool of data from three independent experiments. For each experiment, 20 embryos were injected with 200–300 CFUs, respectively. Left and right panels are for M. abscessus S and R variants, respectively. The M. abscessus S and R wild-type strains used as controls were transformed with pTEC27 but not transformed with pMV306. (C) Representative images of infected zebrafish embryos at 5 days post-infection. Scale bar represents 1 mm. Infection foci are displayed in red.

Figure Data
Acknowledgments
This image is the copyrighted work of the attributed author or publisher, and ZFIN has permission only to display this image to its users. Additional permissions should be obtained from the applicable author or publisher of the image. Full text @ Cells