IMAGE

FIGURE 7

ID
ZDB-IMAGE-201003-27
Source
Figures for Sundaramurthi et al., 2020
Image
Figure Caption

FIGURE 7

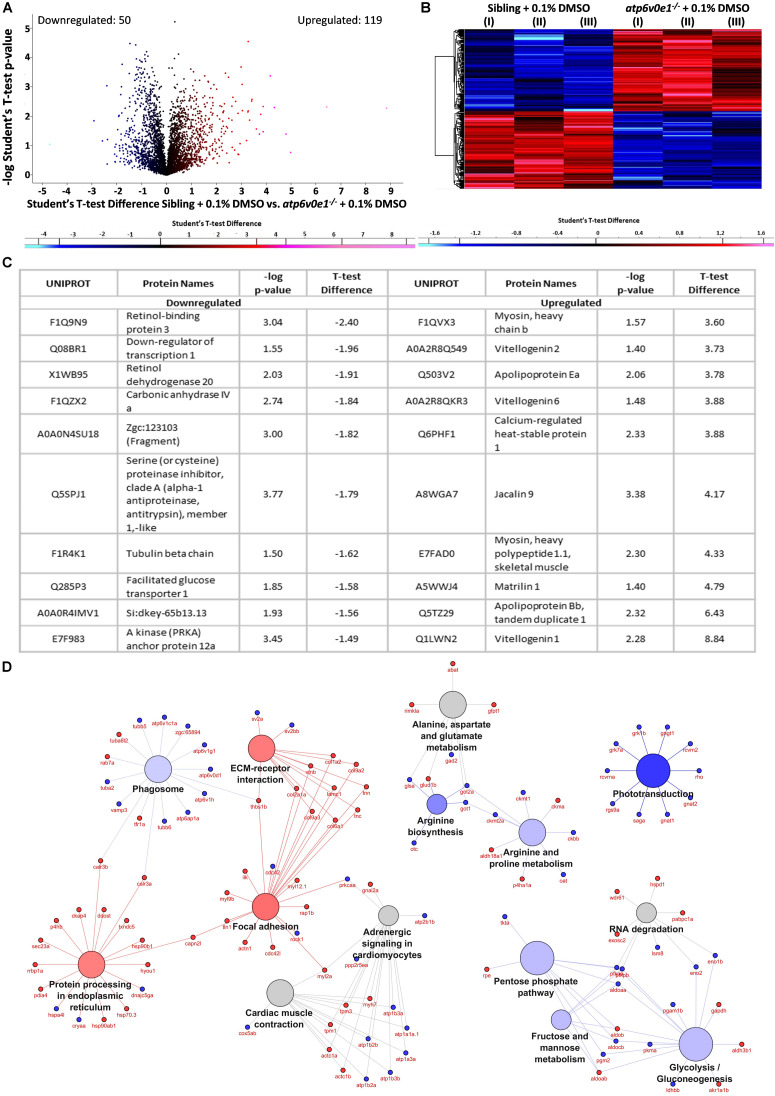
Multiple pathways are implicated in the disease pathomechanism of atp6v0e1–/– as identified by proteome profiling. (A,B) Volcano plot and heatmap representing 790 differentially expressed proteins between vehicle-control treated siblings and atp6v0e1–/–, out of which, 119 proteins were upregulated (in red) and 50 downregulated (in blue) significantly, given a cut-off of fold change ± 1.2 and log p-value ≥ 1.3. Student’s T-Test was used for statistical analysis. (C) Table describing the top-most significantly downregulated and upregulated proteins. (D) KEGG pathway analysis of significantly downregulated and upregulated proteins in vehicle-control treated atp6v0e1–/– compared to vehicle-control treated siblings.

Acknowledgments
This image is the copyrighted work of the attributed author or publisher, and ZFIN has permission only to display this image to its users. Additional permissions should be obtained from the applicable author or publisher of the image. Full text @ Front Cell Dev Biol