IMAGE

Figure 1

ID
ZDB-IMAGE-200826-11
Source
Figures for Cotti et al., 2020
Image
Figure Caption

Figure 1

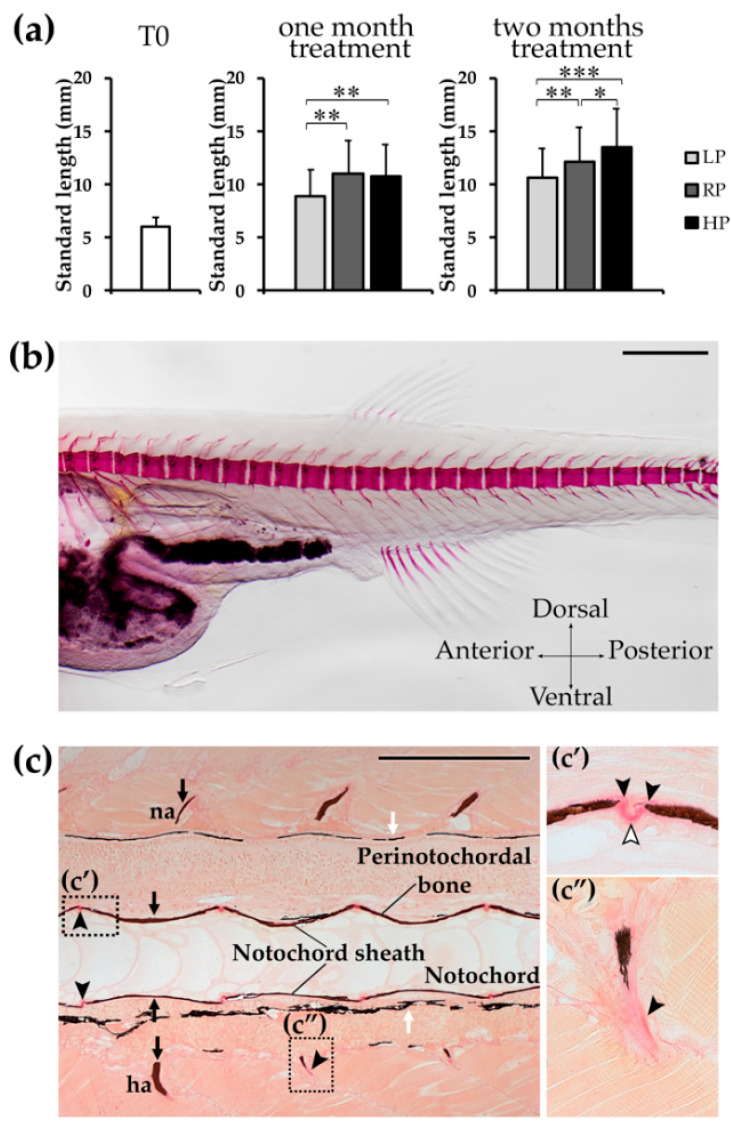
Zebrafish growth and T0 animals. (a) Morphometric analysis of WT zebrafish at the beginning of the experiment (T0, 28dpf) and after one and two months of treatment with the experimental diets. Animals treated with the low P diet (LP) are smaller than controls (RP) and high P diet (HP) treated animals, whereas HP zebrafish present a significantly increased standard length. Mann-Whitney test, *: p < 0.05; **: p < 0.01; ***: p < 0.001. (b) T0 zebrafish, prior the beginning of the experiment, stained with Alizarin red S shows normally developed vertebral column and forming vertebral bodies. No vertebral column malformations, nor vertebral body fusion or compression are present. Scale bar: 500 μm. (c) Notochord sheath, perinotochordal membranous bone and neural (na) and haemal (ha) arches are mineralised in T0 animals, as shown by Von Kossa/Van Gieson staining on sagittal sections. Vertebral bodies are normally shaped and spaced. High magnification panels show (c’) vertebral endplates with osteoid (black arrowheads) and intervertebral ligament (white arrowhead, see Figure 6a for details), (c”) haemal arch with non-mineralised collagen matrix (black arrowhead). Mineralised bone: brown (black arrows); pigment: black (white arrows), non-mineralised collagen matrix/osteoid: red (black arrowhead). Scale bar: 200 µm.

Acknowledgments
This image is the copyrighted work of the attributed author or publisher, and ZFIN has permission only to display this image to its users. Additional permissions should be obtained from the applicable author or publisher of the image. Full text @ Int. J. Mol. Sci.