
Fig. 1
- ID
- ZDB-IMAGE-200426-16
- Genes
- Antibodies
- Publication
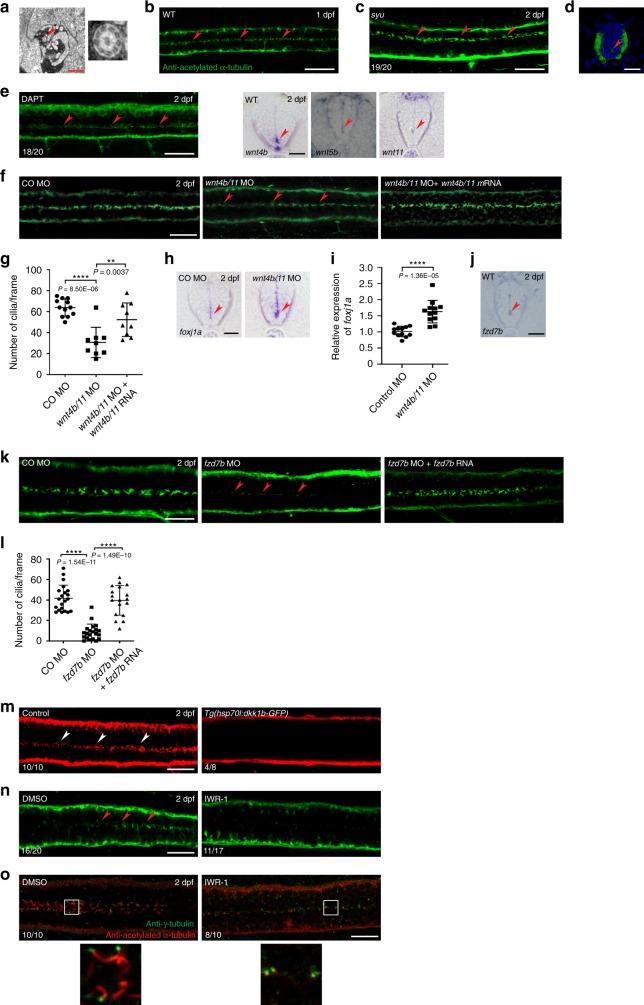
- Zhang et al., 2020 - Wnt-PLC-IP3-Connexin-Ca2+ axis maintains ependymal motile cilia in zebrafish spinal cord
- All Figures
- Figures for Zhang et al., 2020
|
Fig. 1