
IMAGE
Fig 3
- ID
- ZDB-IMAGE-200423-30
- Publication
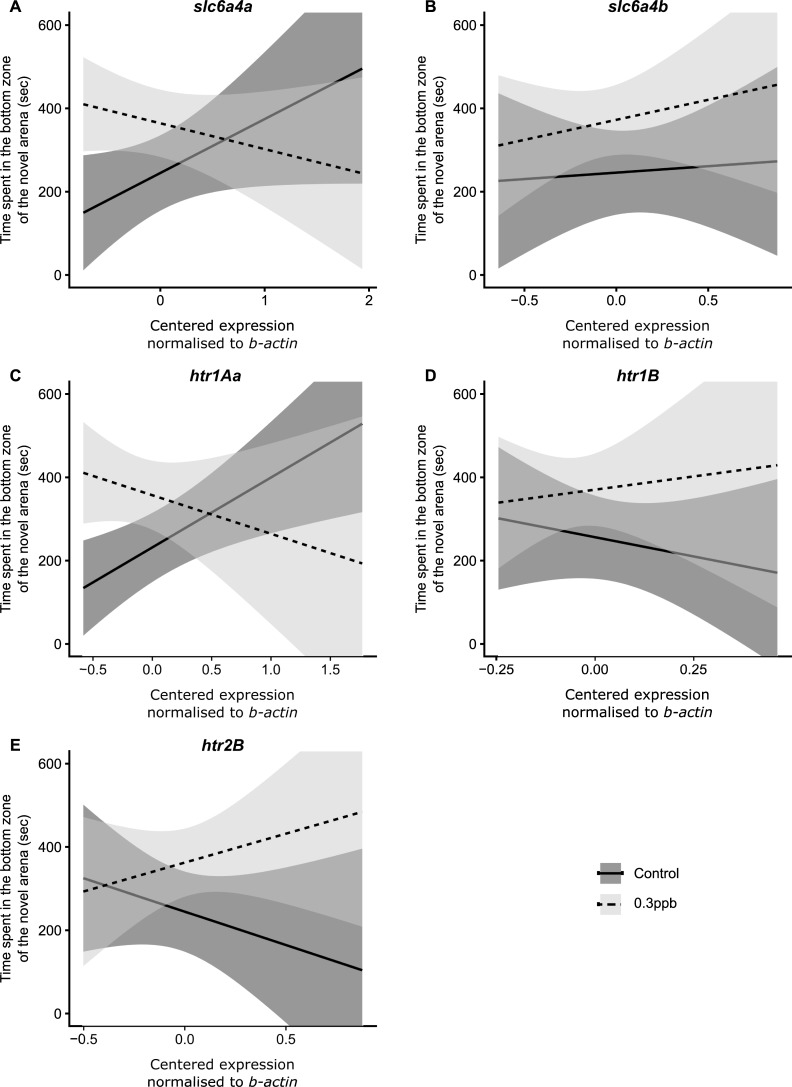
- Lamb et al., 2020 - Paternal exposure to a common herbicide alters the behavior and serotonergic system of zebrafish offspring
- All Figures
- Figures for Lamb et al., 2020
Image
|
Figure Caption
Fig 3
(A)
Acknowledgments
This image is the copyrighted work of the attributed author or publisher, and
ZFIN has permission only to display this image to its users.
Additional permissions should be obtained from the applicable author or publisher of the image.
Full text @ PLoS One