
Image
|
Figure Caption
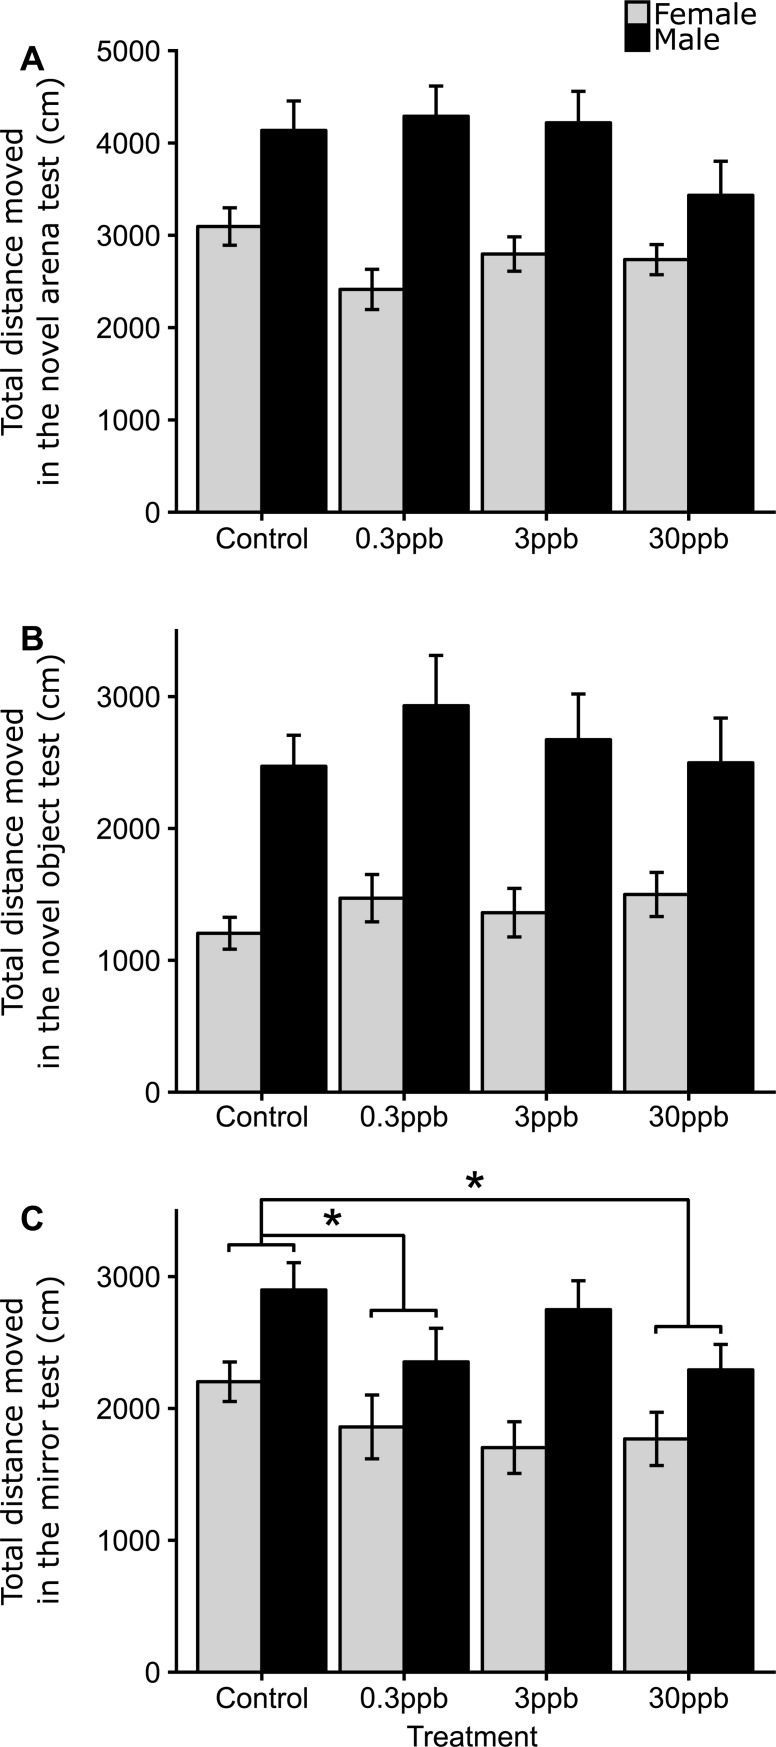
Fig 2
(A) during the novel arena test, (B) the novel object test, (C) and during the mirror test. Bars represent means, with error bars representing standard errors of the mean. An asterisk indicates a significant difference between controls and an atrazine treatment (p <0.05). For each sex and treatment, sample sizes ranged from n = 18–30. Total sample size for F1s were n = 190, with n = 3 families per treatment. See
Acknowledgments
This image is the copyrighted work of the attributed author or publisher, and
ZFIN has permission only to display this image to its users.
Additional permissions should be obtained from the applicable author or publisher of the image.
Full text @ PLoS One