
Image
|
Figure Caption
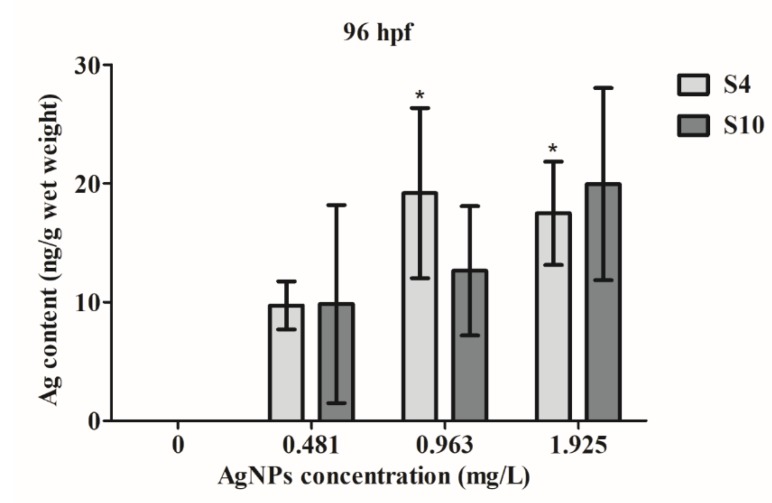
Figure 4
Silver content in wet weight of fish embryos exposed to AgNPs from 4 to 96 hpf. Values represent mean ± standard error. * significant difference between samples and the control groups using one-way ANOVA. *
Acknowledgments
This image is the copyrighted work of the attributed author or publisher, and
ZFIN has permission only to display this image to its users.
Additional permissions should be obtained from the applicable author or publisher of the image.
Full text @ Int. J. Mol. Sci.