IMAGE

Figure 2

ID
ZDB-IMAGE-191230-888
Genes
Source
Figures for Manchanda et al., 2019
Image
Figure Caption

Figure 2

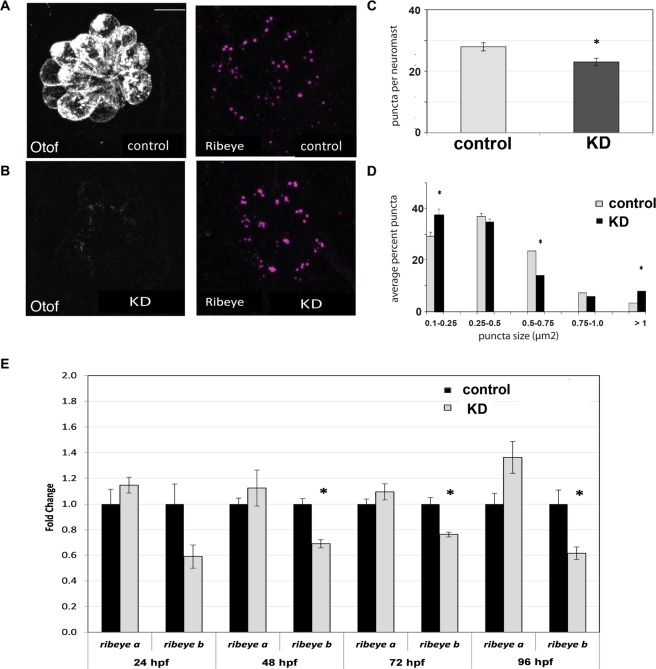
Effects of otoferlin depletion on synaptic morphology in posterior lateral line neuromasts of 96 hpf zebrafish larvae. (A,B) Representative confocal z-projection images of neuromasts from control injected (A) and otoferlin morphant (B) larvae immunolabeled with anti-otoferlin (HCS-1), and anti-Ribeye. (C) Average number of Ribeye puncta counted per neuromast in negative control injected (no. of neuromasts = 20) and morphant (no. of neuromasts = 18) larvae (t-test, p-value < 0.0001). Error bars indicate s.e.m. (D) Average percent of Ribeye puncta per neuromast that fell within size bins of 0.1–0.25, 0.25–0.5, 0.5–0.75, 0.75–1.0, and >1.0 µm2, in control injected (no. of neuromasts = 20) and morphant (no. of neuromasts = 18) larvae (t-test, p-value < 0.0001), Error bars indicate s.e.m. (E) Expression of ribeye transcripts in control and morphant larvae at 24, 48, 72, and 96 hpf, N = 4 per time point (t-test, p-value < 0.05). Scale bars = 5 µm.

Figure Data
Acknowledgments
This image is the copyrighted work of the attributed author or publisher, and ZFIN has permission only to display this image to its users. Additional permissions should be obtained from the applicable author or publisher of the image. Full text @ Sci. Rep.