
|
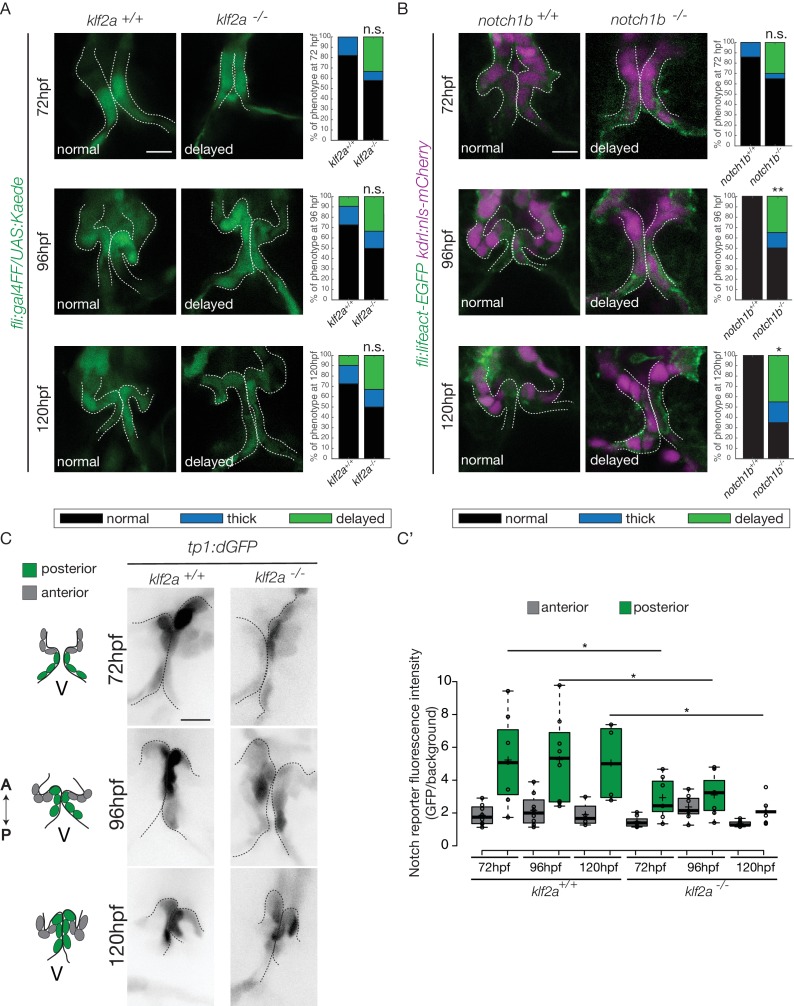
Figure 7 Klf2a and notch are necessary for valve formation. Quantification of the valve phenotypes at 72 hpf, 96 hpf and 120 hpf (normal, thick, delayed) in klf2a+/+(n = 11), and klf2a-/- (n = 12) using the Tg(fli:gal4FF/UAS:Kaede). (A) and notch1b+/+ (n = 7) and notch1b-/- (n = 20) using Tg(fli:lifeact-EGFP; kdrl:nls-mCherry) embryos. (B) Scale bar: 10 µm. N = 3 independent experiments. (C) Confocal z-sections of the Tg(tp1:dGFP) in klf2a+/+ and klf2a-/- embryos at 72 hpf, 96 hpf and 120 hpf. V: ventricle. Scale bar: 10 µm. (C’) Quantification of the fluorescent intensity of the Notch reporter (GFP over background) in the anterior versus posterior parts of the valves in in klf2a+/+ (n = 5) and klf2a-/- (n = 4) embryos. Statistical test were performed to compare the posterior intensities in klf2a+/+versus klf2a-/- at 72 hpf (p=0,05), 96 hpf (p=0,03) and 120 hpf (p=0,04). Student’s t-test. Boxplot: Center lines show the medians; box limits indicate the 25th and 75th percentiles as determined by R software; whiskers extend 1.5 times the interquartile range from the 25th and 75th percentiles, outliers are represented by dots. Results obtained from three independent experiments.