IMAGE

Figure 4

ID
ZDB-IMAGE-191230-1112
Genes
Antibodies
Source
Figures for Chen et al., 2019
Image
Figure Caption

Figure 4

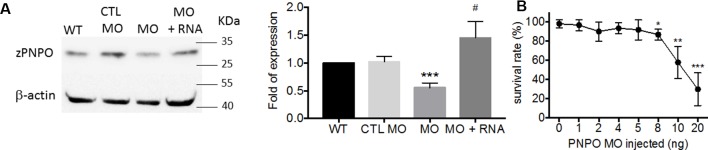
The impact of knocking down zPnpo. (A) The protein levels of zPnpo in zebrafish embryos injected with 10 ng of scrambled control MO (CTL MO; lane 2), 10 ng of zPnpo MO (MO; lane 3), or zPnpo MO plus 800 pg of zebrafish pnpo mRNA (MO + RNA; lane 4) at 14 hpf and wild-type embryos of the same stage (WT; lane 1) were analyzed with Western blotting (left) and quantified by normalizing with β-actin (right). Shown here are the representative image and average of at least five independent repeats. (B) Dose-dependent decreased survival was observed in zPnpo morphants at 3 dpf. Data presented were the representatives and averages of at least three independent repeats with n = 40∼60 embryos for each group and expressed as mean ± SEM. The statistical significance was calculated with one-tailed Mann–Whitney nonparametric U test by comparing the experimental groups with wild type (*) or with zPnpo MO (#). */#p < 0.05; **p < 0.01; ***p < 0.001. MO, morpholino oligonucleotide.

Figure Data
Acknowledgments
This image is the copyrighted work of the attributed author or publisher, and ZFIN has permission only to display this image to its users. Additional permissions should be obtained from the applicable author or publisher of the image. Full text @ Front Pharmacol