IMAGE

Fig. 2.

ID
ZDB-IMAGE-190723-2697
Source
Figures for Ugwuagbo et al., 2019
Image
Figure Caption

Fig. 2.

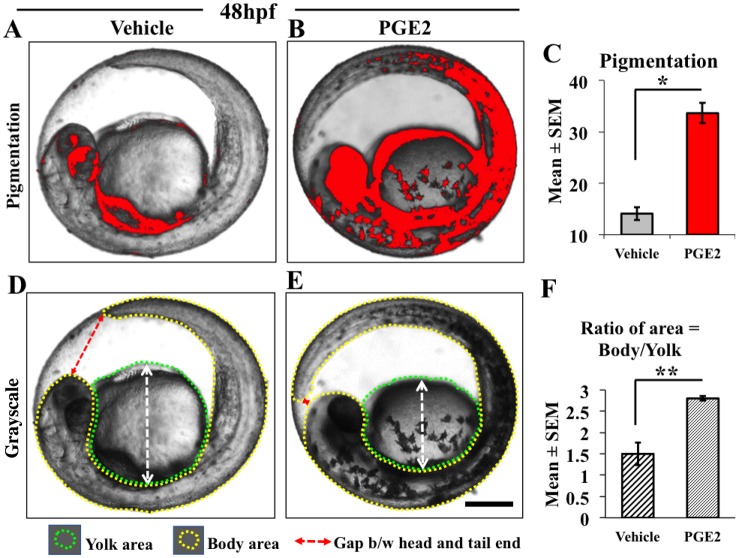
PGE2 increases zebrafish embryonic development and pigmentation at 48 hpf. For the measurement of pigmentation, the gray-scaled images from the stereomicroscope were converted to red-colored scale using ImageJ. The red color intensity of the pigmented areas in the vehicle (A) was used as a threshold to measure PGE2-induced pigmentation (B). We selected a few embryos from three biological replicates for this quantification. (C) Data are represented as mean of embryonic pigmentation for PGE2 (n=10) and vehicle (n=11) groups±s.e.m. An unpaired t-test comparing means showed a significant upregulation of embryonic pigmentation in PGE2 group with a two-tailed unpaired t-test, *P=0.0001. (E) The PGE2-treated fish is larger with the tail almost reaching the head in the embryonic sac (dotted red line with arrow) compared to the vehicle (D). We measured the areas of the fish body (denoted with yellow dotted line) and yolk sac (denoted with green dotted line) and calculated the ratio of the areas as body/yolk. (F) The chart shows a very significant growth difference between the PGE2 and vehicle groups with a two-tailed unpaired t-test, **P=0.0086. Scale bar: 10 μm.

Acknowledgments
This image is the copyrighted work of the attributed author or publisher, and ZFIN has permission only to display this image to its users. Additional permissions should be obtained from the applicable author or publisher of the image. Full text @ Biol. Open