IMAGE

Fig 6

ID
ZDB-IMAGE-190723-207
Genes
Source
Figures for Hartwell et al., 2019
Image
Figure Caption

Fig 6 Mis-expression of <italic>hmx3a</italic> is not sufficient to generate an anterior ear duplication.

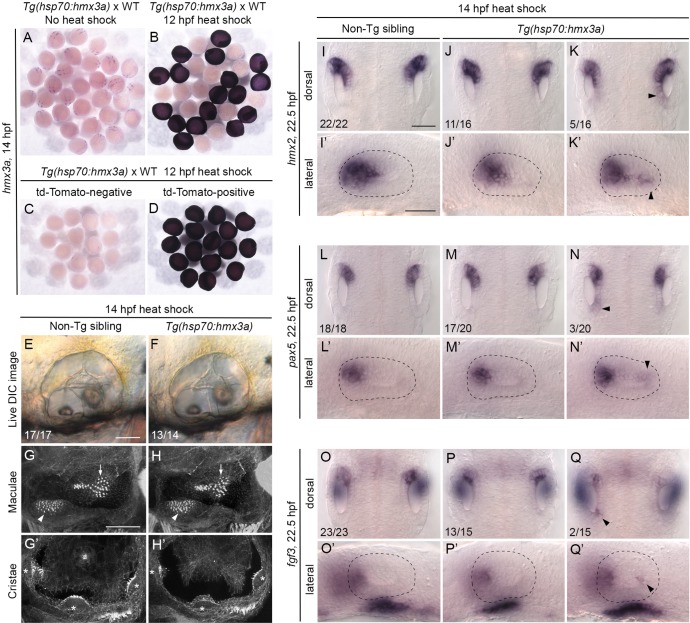
(A–D) Control experiments to check for successful expression of the hmx3a transgene after heat shock at 12 hpf. Embryos were fixed and stained by in situ hybridisation two hours later, at 14 hpf. (A,B) A mixed batch of embryos from a cross between a fish hemizygous for the transgene and a wild type (WT). All embryos (31/31) showed the normal pattern of expression of hmx3a in the absence of heat shock (A). After a 60-minute heat shock at 12 hpf, ~50% of the batch (17/30) showed strong, systemic expression of the transgene at 14 hpf, as expected (B). All embryos shown in B were stained in the same tube. (C,D) Embryos heat-shocked for 60 minutes at 12 hpf were sorted on the basis of tdTomato expression before fixing. All tdTomato-negative embryos (14/14) were also negative for expression of the hmx3a transgene (C); all tdTomato-positive embryos (16/16) were also positive for hmx3a transgene expression (D). (E,F) Live DIC images of ears of non-transgenic (E) and transgenic (F) sibling embryos at 3 dpf (72 hpf), after a 30-minute heat shock at 14 hpf. (G–H’) Confocal images of FITC-phalloidin-stained ears at 3 dpf (72 hpf). Position and size of the two maculae (G,H, arrowheads and arrows) and three cristae (G’,H’, asterisks) were normal in both non-transgenic and transgenic sibling embryos after heat shock. (I–Q’) In situ hybridisation for otic marker genes in non-transgenic and Tg(hsp70:hmx3a) sibling embryos after a 30-minute heat shock at 14 hpf. Dorsal views of both otic vesicles (I–Q) and lateral views of a single otic vesicle (I’–Q’) are shown. Note weak ectopic expression of hmx2 and pax5, and posterior otic expression of fgf3, in the otic vesicles of a minority of transgenic embryos (right hand column; arrowheads). Numbers of embryos showing the phenotypes are shown for each panel. WT, wild type (AB strain). Scale bar in E, 50 μm (applies to E–F); scale bar in G, 50 μm (applies to G–H’); scale bar in I, 50 μm (applies to I–Q); scale bar in I’, 50 μm (applies to I’–Q’).

Figure Data
Acknowledgments
This image is the copyrighted work of the attributed author or publisher, and ZFIN has permission only to display this image to its users. Additional permissions should be obtained from the applicable author or publisher of the image. Full text @ PLoS Genet.