
Image
|
Figure Caption
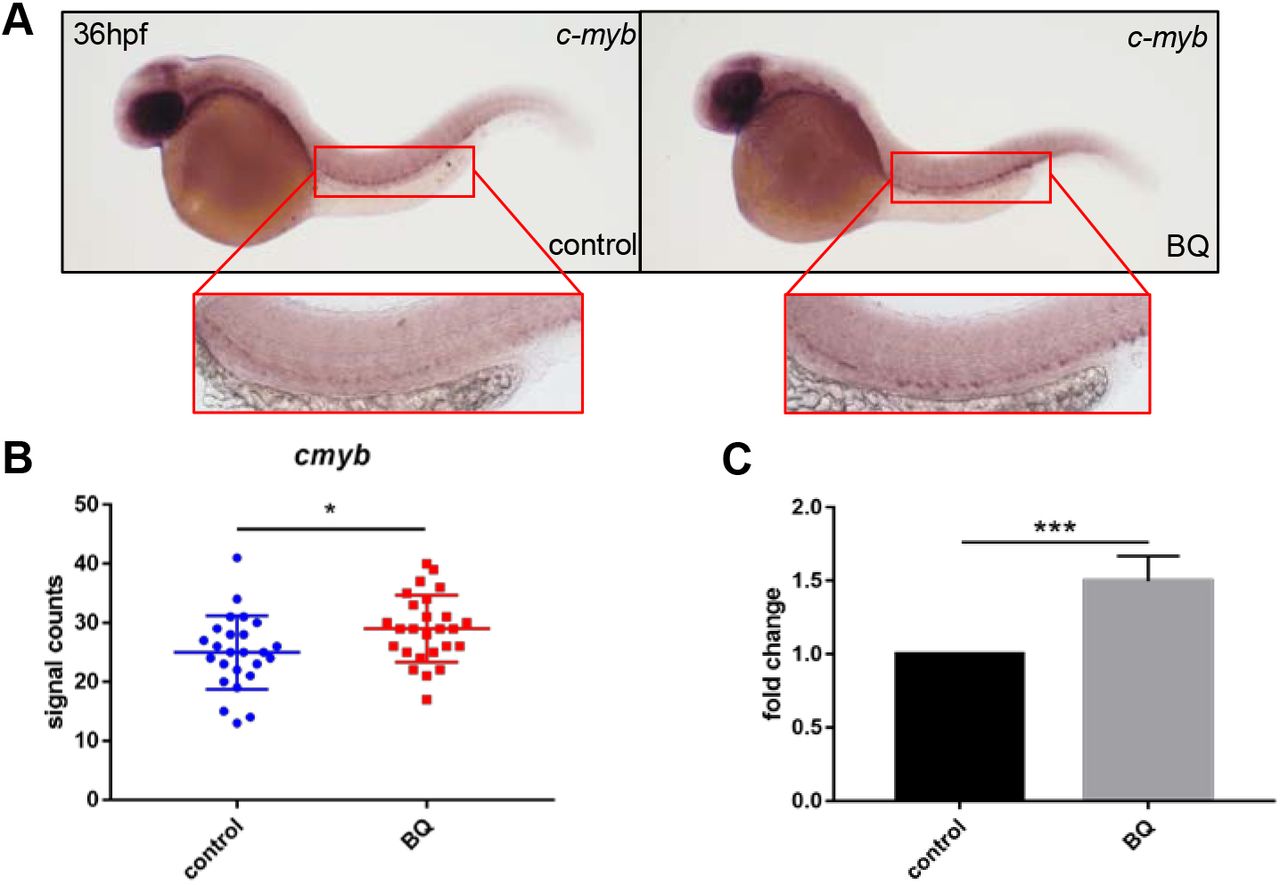
Fig. 4
Effect of BQ exposure on c-myb expression. (A–C) BQ exposure increased c-myb expression. Both WISH performed at 36 hpf (A,B) and RT-qPCR performed at 2 dpf (C) indicated increased expression of c-myb in BQ-exposed (right, A) and control (left, A) groups (Student's t-test, n=25 or 26, mean±s.d., *P<0.05, ***P<0.001). The red boxed regions show magnified views of the aorta-gonad-mesonephros (AGM).
Figure Data
Acknowledgments
This image is the copyrighted work of the attributed author or publisher, and
ZFIN has permission only to display this image to its users.
Additional permissions should be obtained from the applicable author or publisher of the image.
Full text @ Dis. Model. Mech.