
|
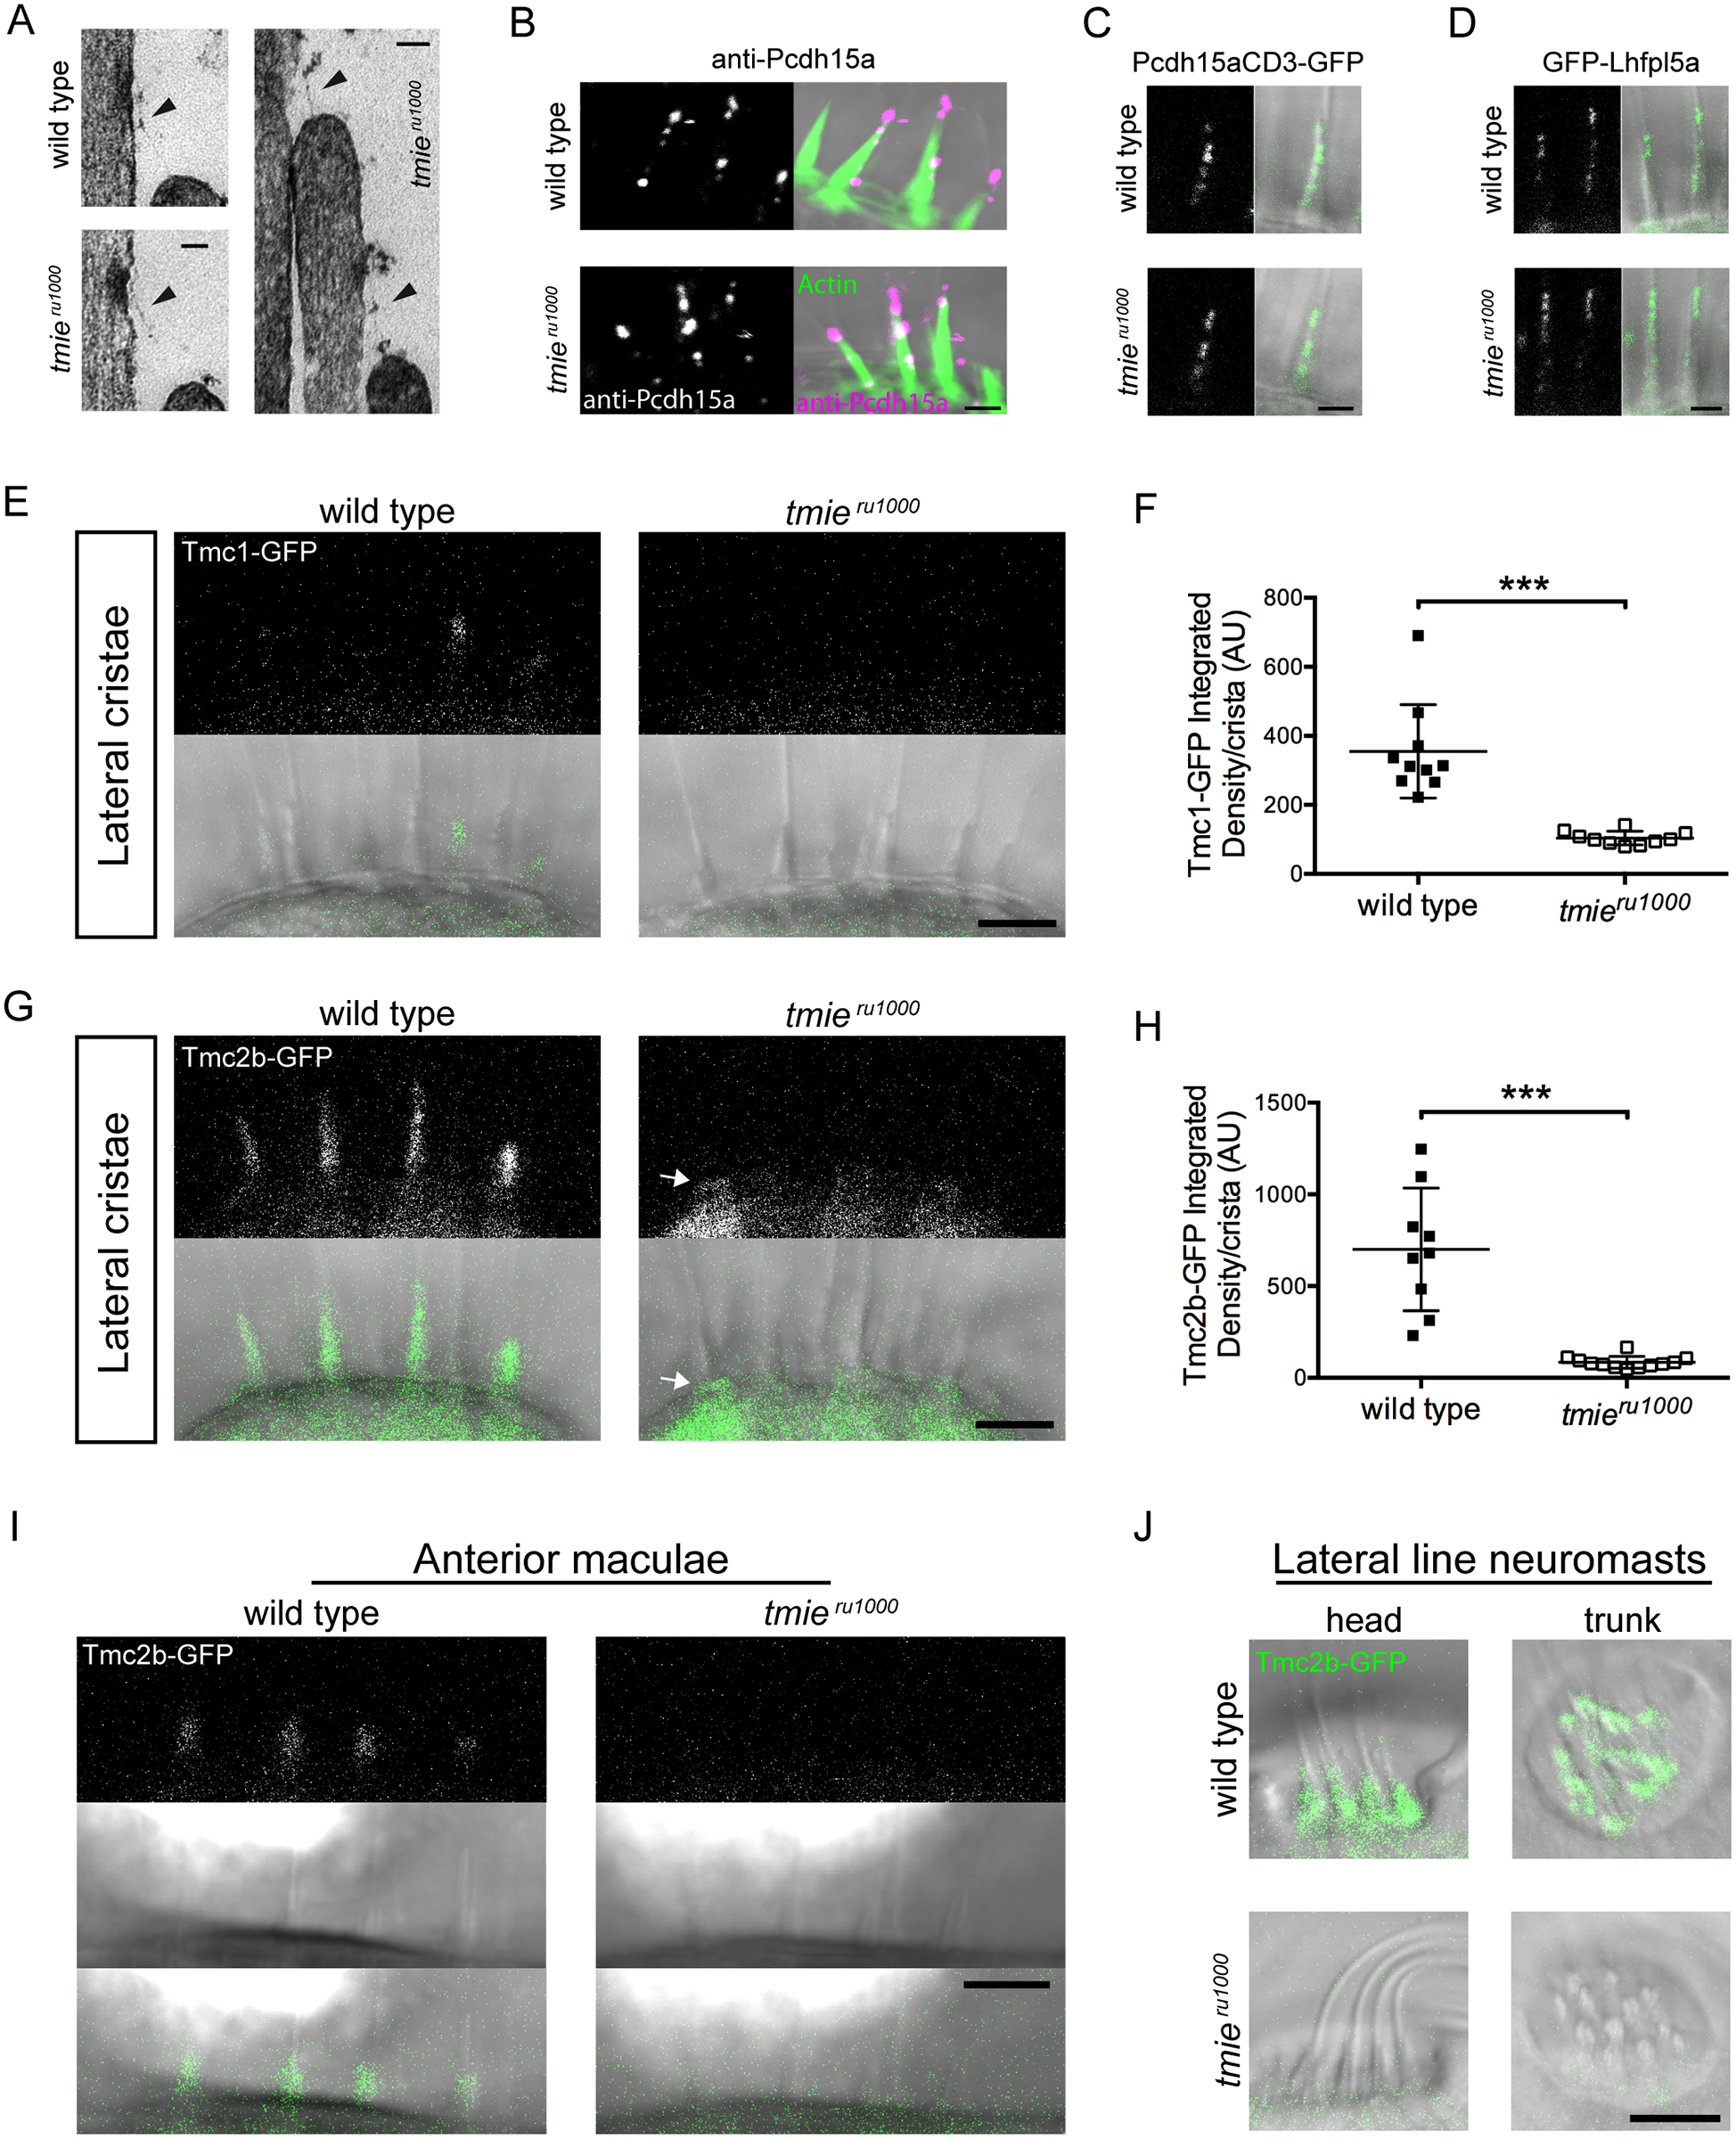
Fig. 3
Images in A were collected using a transmission electron microscope (TEM). Images in B-J were collected using confocal microscopy. (A) TEM sections stained with 4% uranyl acetate and lead citrate. (B) Antibody labeling of Pcdh15a (magenta). Phalloidin was used to label actin (green). (C, D) Hair cells from the lateral cristae in 6 dpf larvae expressing either transgenic Pcdh15aCD3-GFP (C) or GFP-Lhfpl5a (D) (n = 6 each genotype). (E) Images of the lateral cristae in 4 dpf larvae expressing Tmc1-GFP. (F) Plot of the integrated density of Tmc1-GFP fluorescence in the ROI, expressed in arbitrary units; each data point represents one crista. Statistical significance determined by two-tailed unpaired t-test with Welch’s correction, p = 0.0002. (G) Images of the lateral cristae in 4 dpf larvae expressing Tmc2b-GFP. The arrow points to the cuticular plate/apical soma region, just below the ROI. (H) Plot of the integrated density of Tmc2b-GFP fluorescence in the ROI, expressed in arbitrary units. Statistical significance determined by two-tailed unpaired t-test with Welch’s correction, p = 0.0005. (I) Representatives images of anterior maculae in 2 dpf larvae expressing Tmc2b-GFP. We examined n = 14 wild type and n = 13 tmieru1000 maculae. (J) Representative images of lateral line neuromasts in 4 dpf larvae expressing Tmc2b-GFP. We examined n = 18 wild type and n = 20 tmieru1000 neuromasts. All statistics are mean ± SD. Scale bar in A is 50 nm, in B-D are 2 μm, in E-J are 5μm.