
|
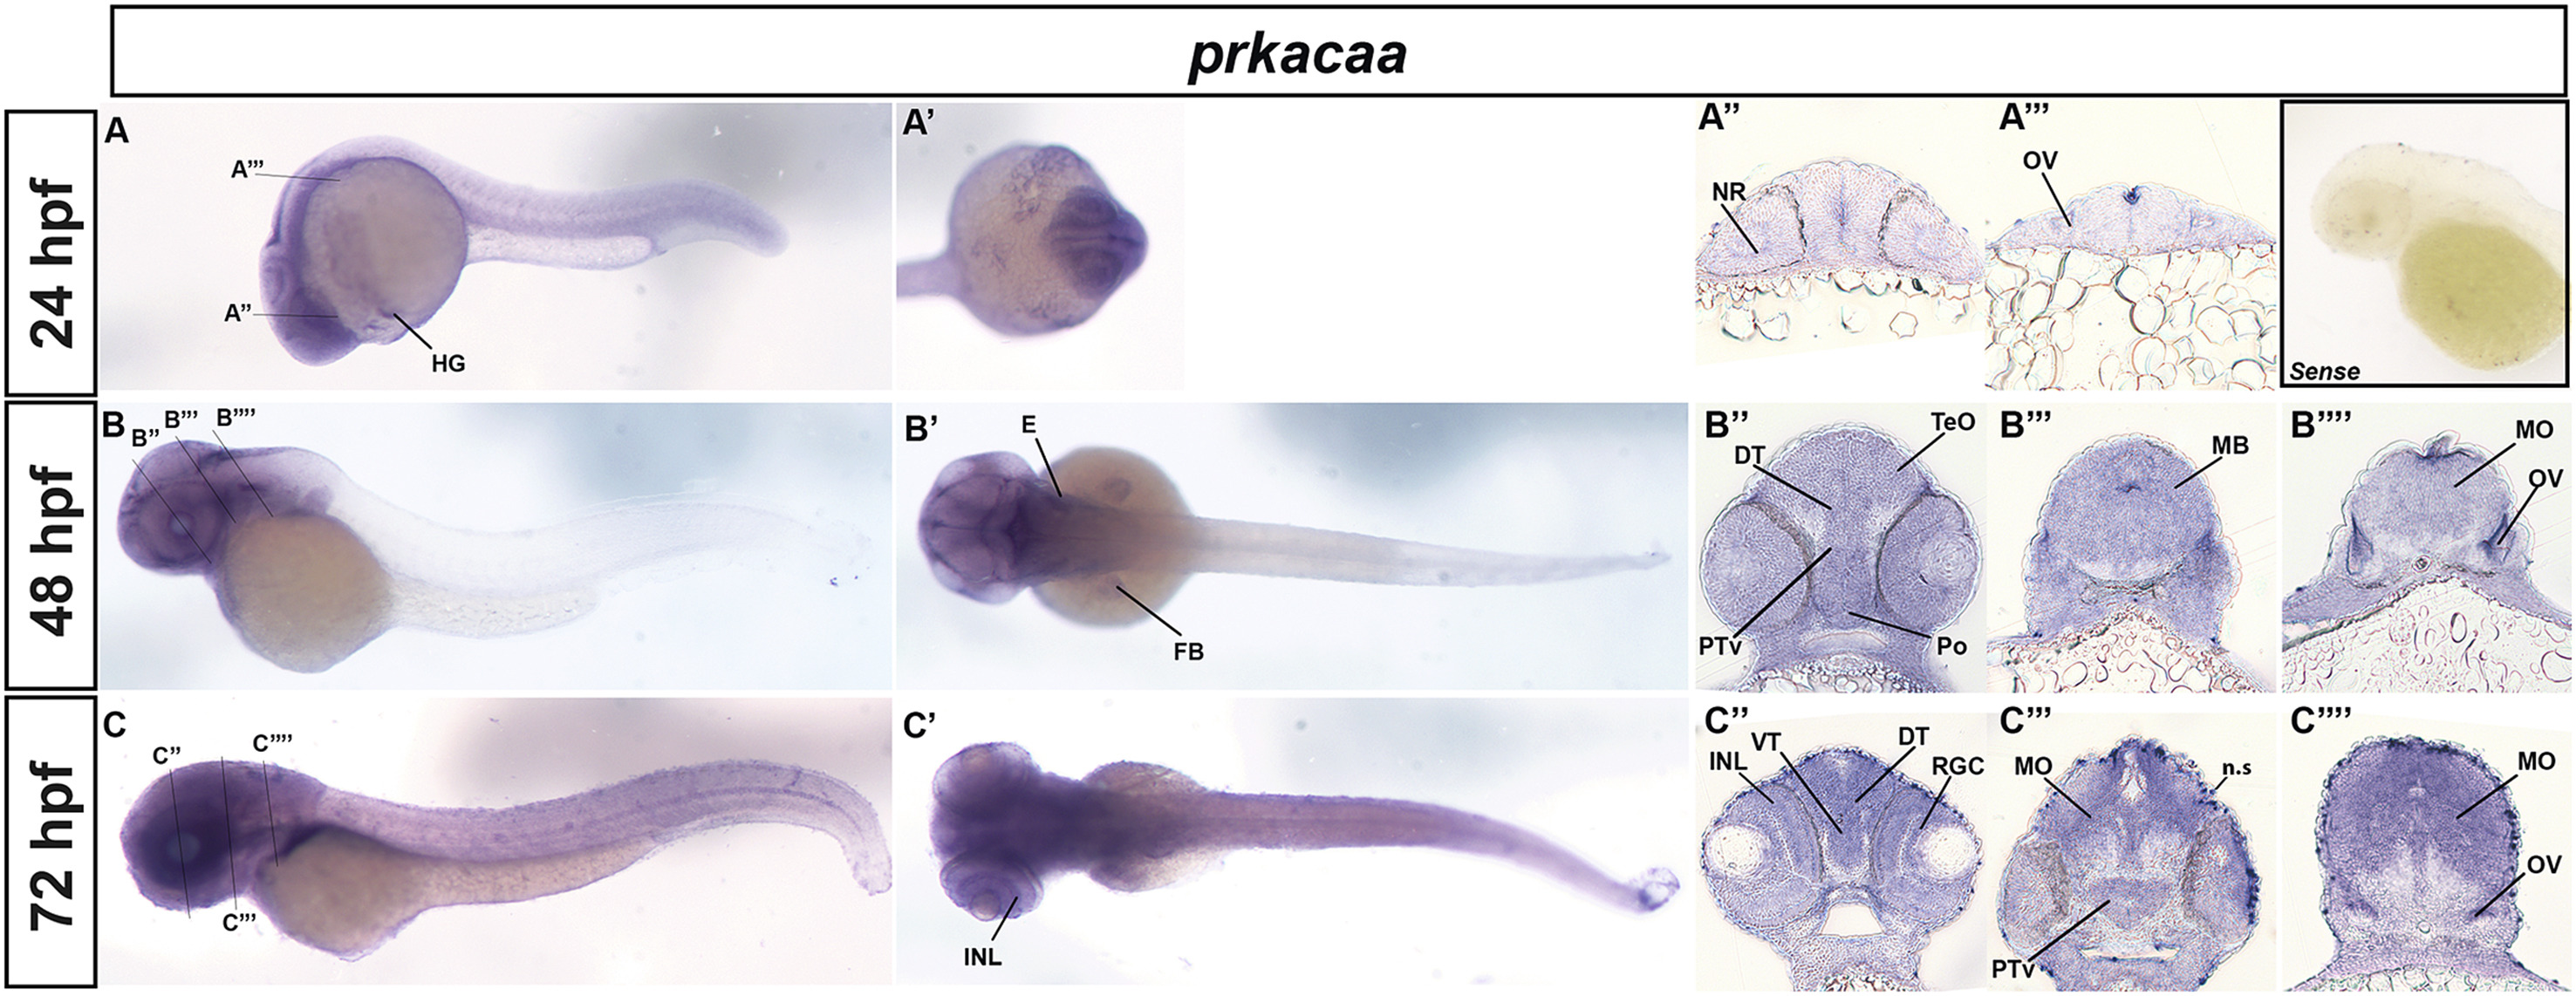
Fig. 2 prkacαa neuronal expression patterns. Brightfield images of zebrafish embryos processed for in situ hybridization. (A–C) Whole-mount lateral, (A′-C′) whole-mount dorsal. Brightfield sections (A″-C″) forebrain, (A‴-C‴) midbrain and (B‴‘-C‴‘) hindbrain. Embryos were imaged at different developmental time points. (A-A‴) 24 hpf, (BB‴‘) 48 hpf, (CC‴‘) 72 hpf. Lines in (A–C) indicate locations of the sections shown at that time-point. Hpf-hours post fertilization, NR-neural retina, OV otic vesicle, E−ear, FB fin bud, DT-dorsal thalamus, TeO optic tectum, Popre-optic region, PTv-ventral part of the posterior tuberculum, INL-inner nuclear layer, MB- mid brain, VT-ventral thalamus, RGC- retinal ganglion cell layer, MO- medulla oblongata, n.s-non-specific. Inset shows sense probe control.
Reprinted from Gene expression patterns : GEP, 31, Emerson, S.E., Grebber, B.K., McNelllis, M., Orr, A.R., Deming, P.B., Ebert, A.M., Developmental expression patterns of protein kinase A catalytic subunits in zebrafish, 1-6, Copyright (2018) with permission from Elsevier. Full text @ Gene Expr. Patterns