
Image
|
Figure Caption
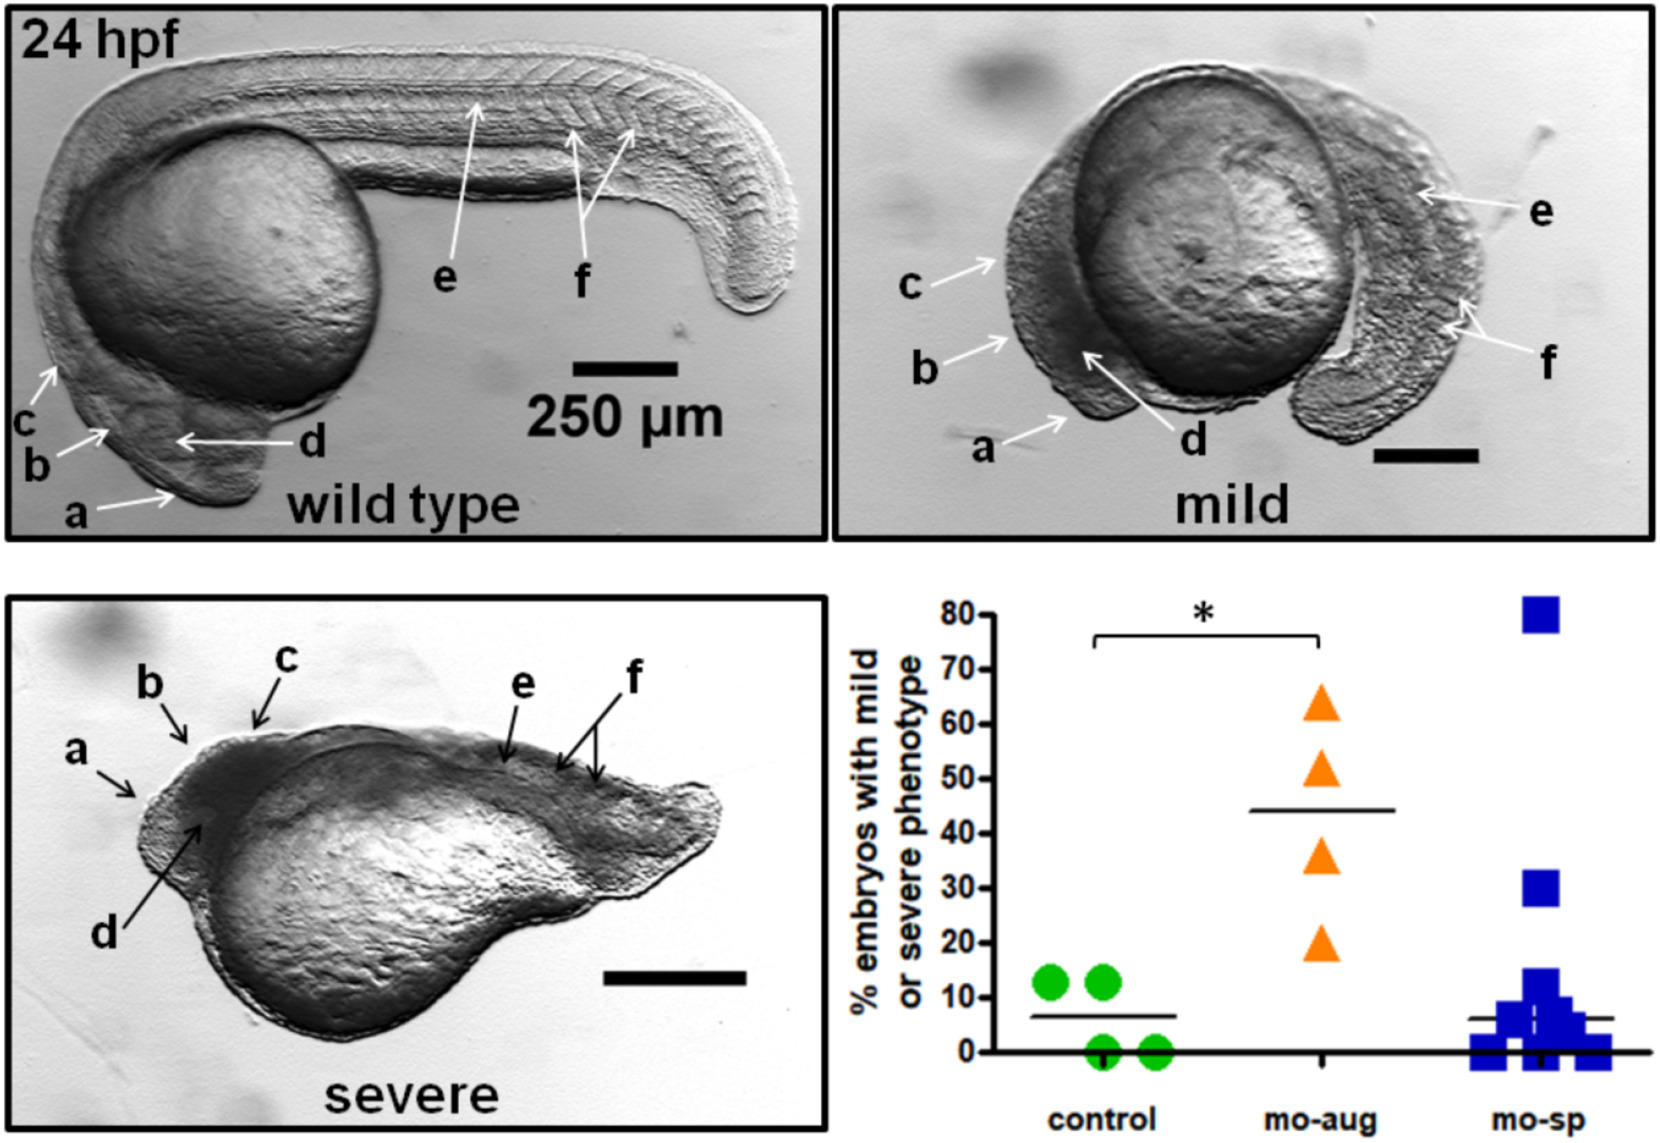
Fig. 4 Phenotype of the CTCF morphants. 1-cell to 2-cell embryos were injected with mo-aug or mo-sp. A range of phenotypes was found at 24 hpf, from wild type, mild and severe phenotypes. Different structures were affected: a. Forebrain, b. Midbrain, c. Hindbrain, d. Eye, e. Notochord f. Somites. The percentages and the median of embryos with a mild or severe phenotype are shown in the graph. The statistical difference is noted with an asterisk (n = 4 assays, p = 0.006 for mo-aug; n = 9 assays, p = 0.2609 for mo-sp; one-tailed unpaired t-tests).
Figure Data
Acknowledgments
This image is the copyrighted work of the attributed author or publisher, and
ZFIN has permission only to display this image to its users.
Additional permissions should be obtained from the applicable author or publisher of the image.
Reprinted from Mechanisms of Development, 154, Carmona-Aldana, F., Zampedri, C., Suaste-Olmos, F., Murillo-de-Ozores, A., Guerrero, G., Arzate-Mejía, R., Maldonado, E., Navarro, R., Chimal-Monroy, J., Recillas-Targa, F., CTCF knockout reveals an essential role for this protein during the zebrafish development, 51-59, Copyright (2018) with permission from Elsevier. Full text @ Mech. Dev.