
|
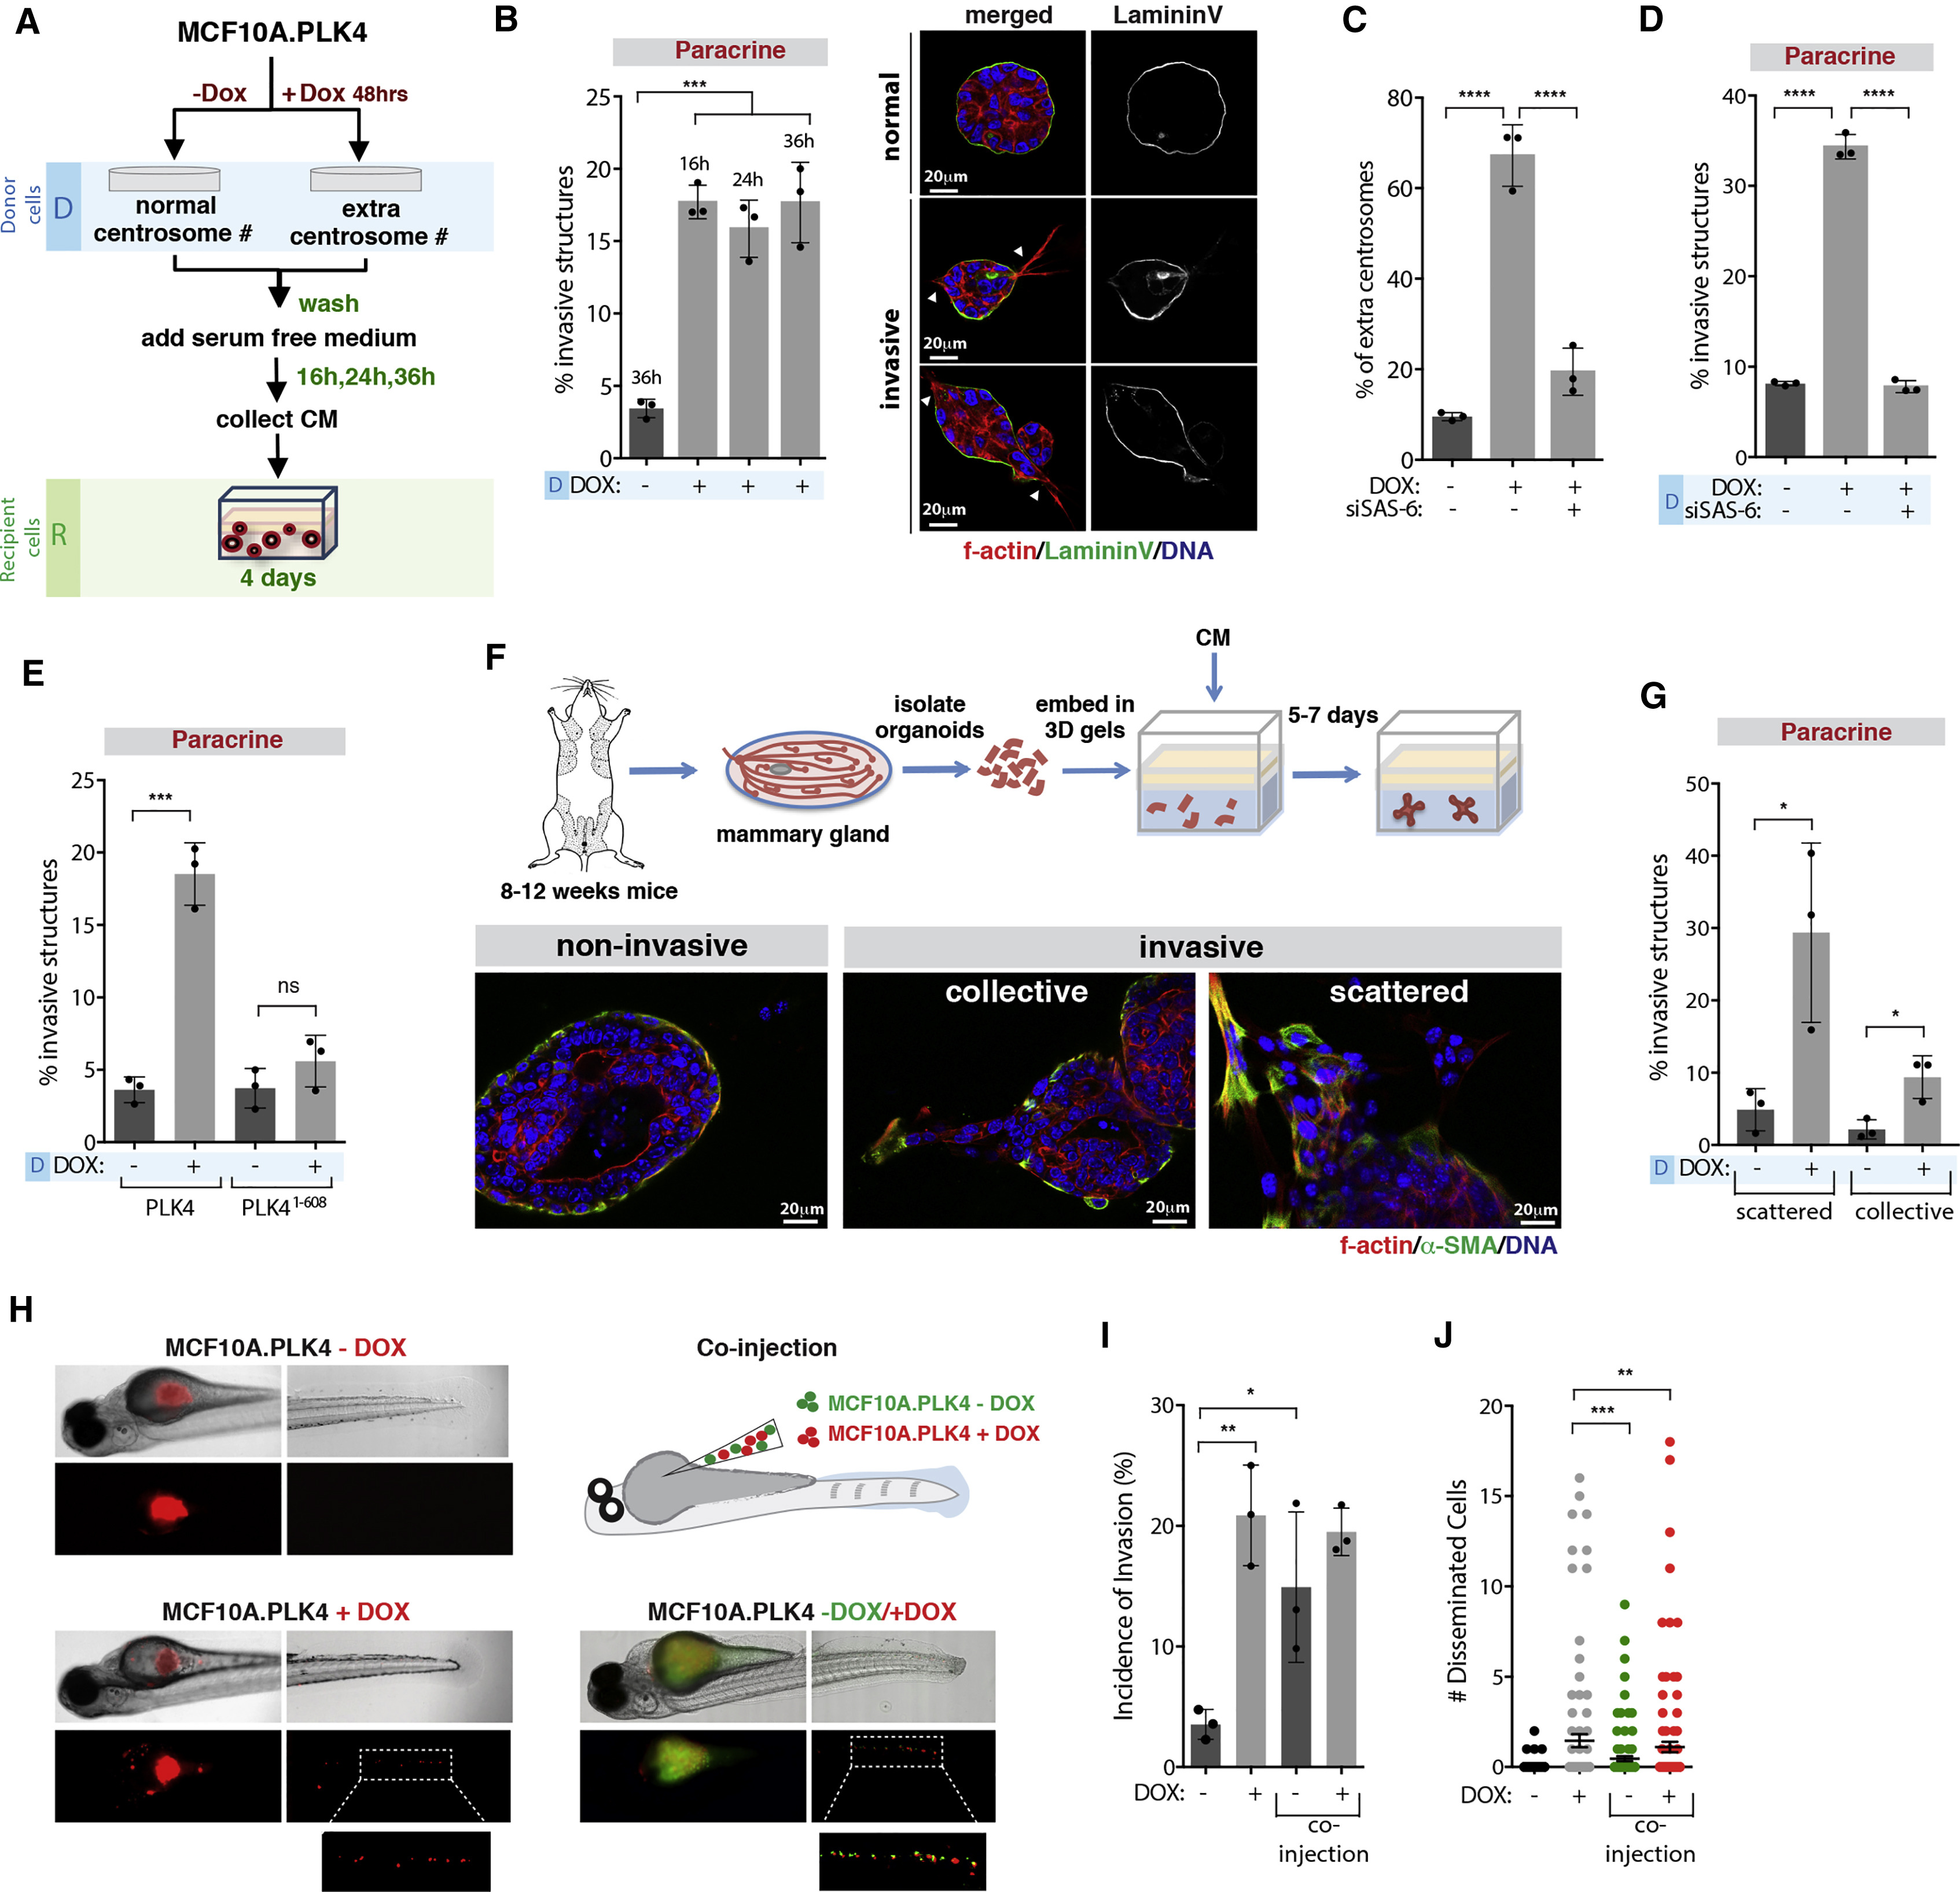
Fig. 1
Centrosome Amplification Induces Paracrine Invasion
(A) Experimental flowchart.
(B) Left, quantification of invasive structures. Right, normal and invasive 3D acini. White arrowheads indicate invasive protrusions. Scale bar: 20 μM.
(C) Quantification of centrosome amplification.
(D) Quantification of invasive structures.
(E) Quantification of invasive structures.
(F) Top, schematic representation of mammary organoids isolation and growth. Bottom, non-invasive and invasive mammary organoids. Scale bar: 20 μM.
(G) Quantification of invasive organoids.
(H) Images of zebrafish injected with cells with (+DOX) or without (−DOX) extra centrosomes (left) or co-injected +DOX/−DOX (right).
(I) Incidence of invasive cells in zebrafish embryos. Number of injected fish −DOX = 121; +DOX = 103; and co-injection +/−DOX = 116.
(J) Number of disseminated cells in the zebrafish tail. Error bars represent mean ± SEM.
For all graphics, error bars represent mean ± SD from three independent experiments. ∗p < 0.05, ∗∗p < 0.01, ∗∗∗p < 0.001, ∗∗∗∗p < 0.0001; ns not significant.
See also Figure S1; Videos S1, S2, S3, and S4; Table S1.
Reprinted from Developmental Cell, 47, Arnandis, T., Monteiro, P., Adams, S.D., Bridgeman, V.L., Rajeeve, V., Gadaleta, E., Marzec, J., Chelala, C., Malanchi, I., Cutillas, P.R., Godinho, S.A., Oxidative Stress in Cells with Extra Centrosomes Drives Non-Cell-Autonomous Invasion, 409-424.e9, Copyright (2018) with permission from Elsevier. Full text @ Dev. Cell