
|
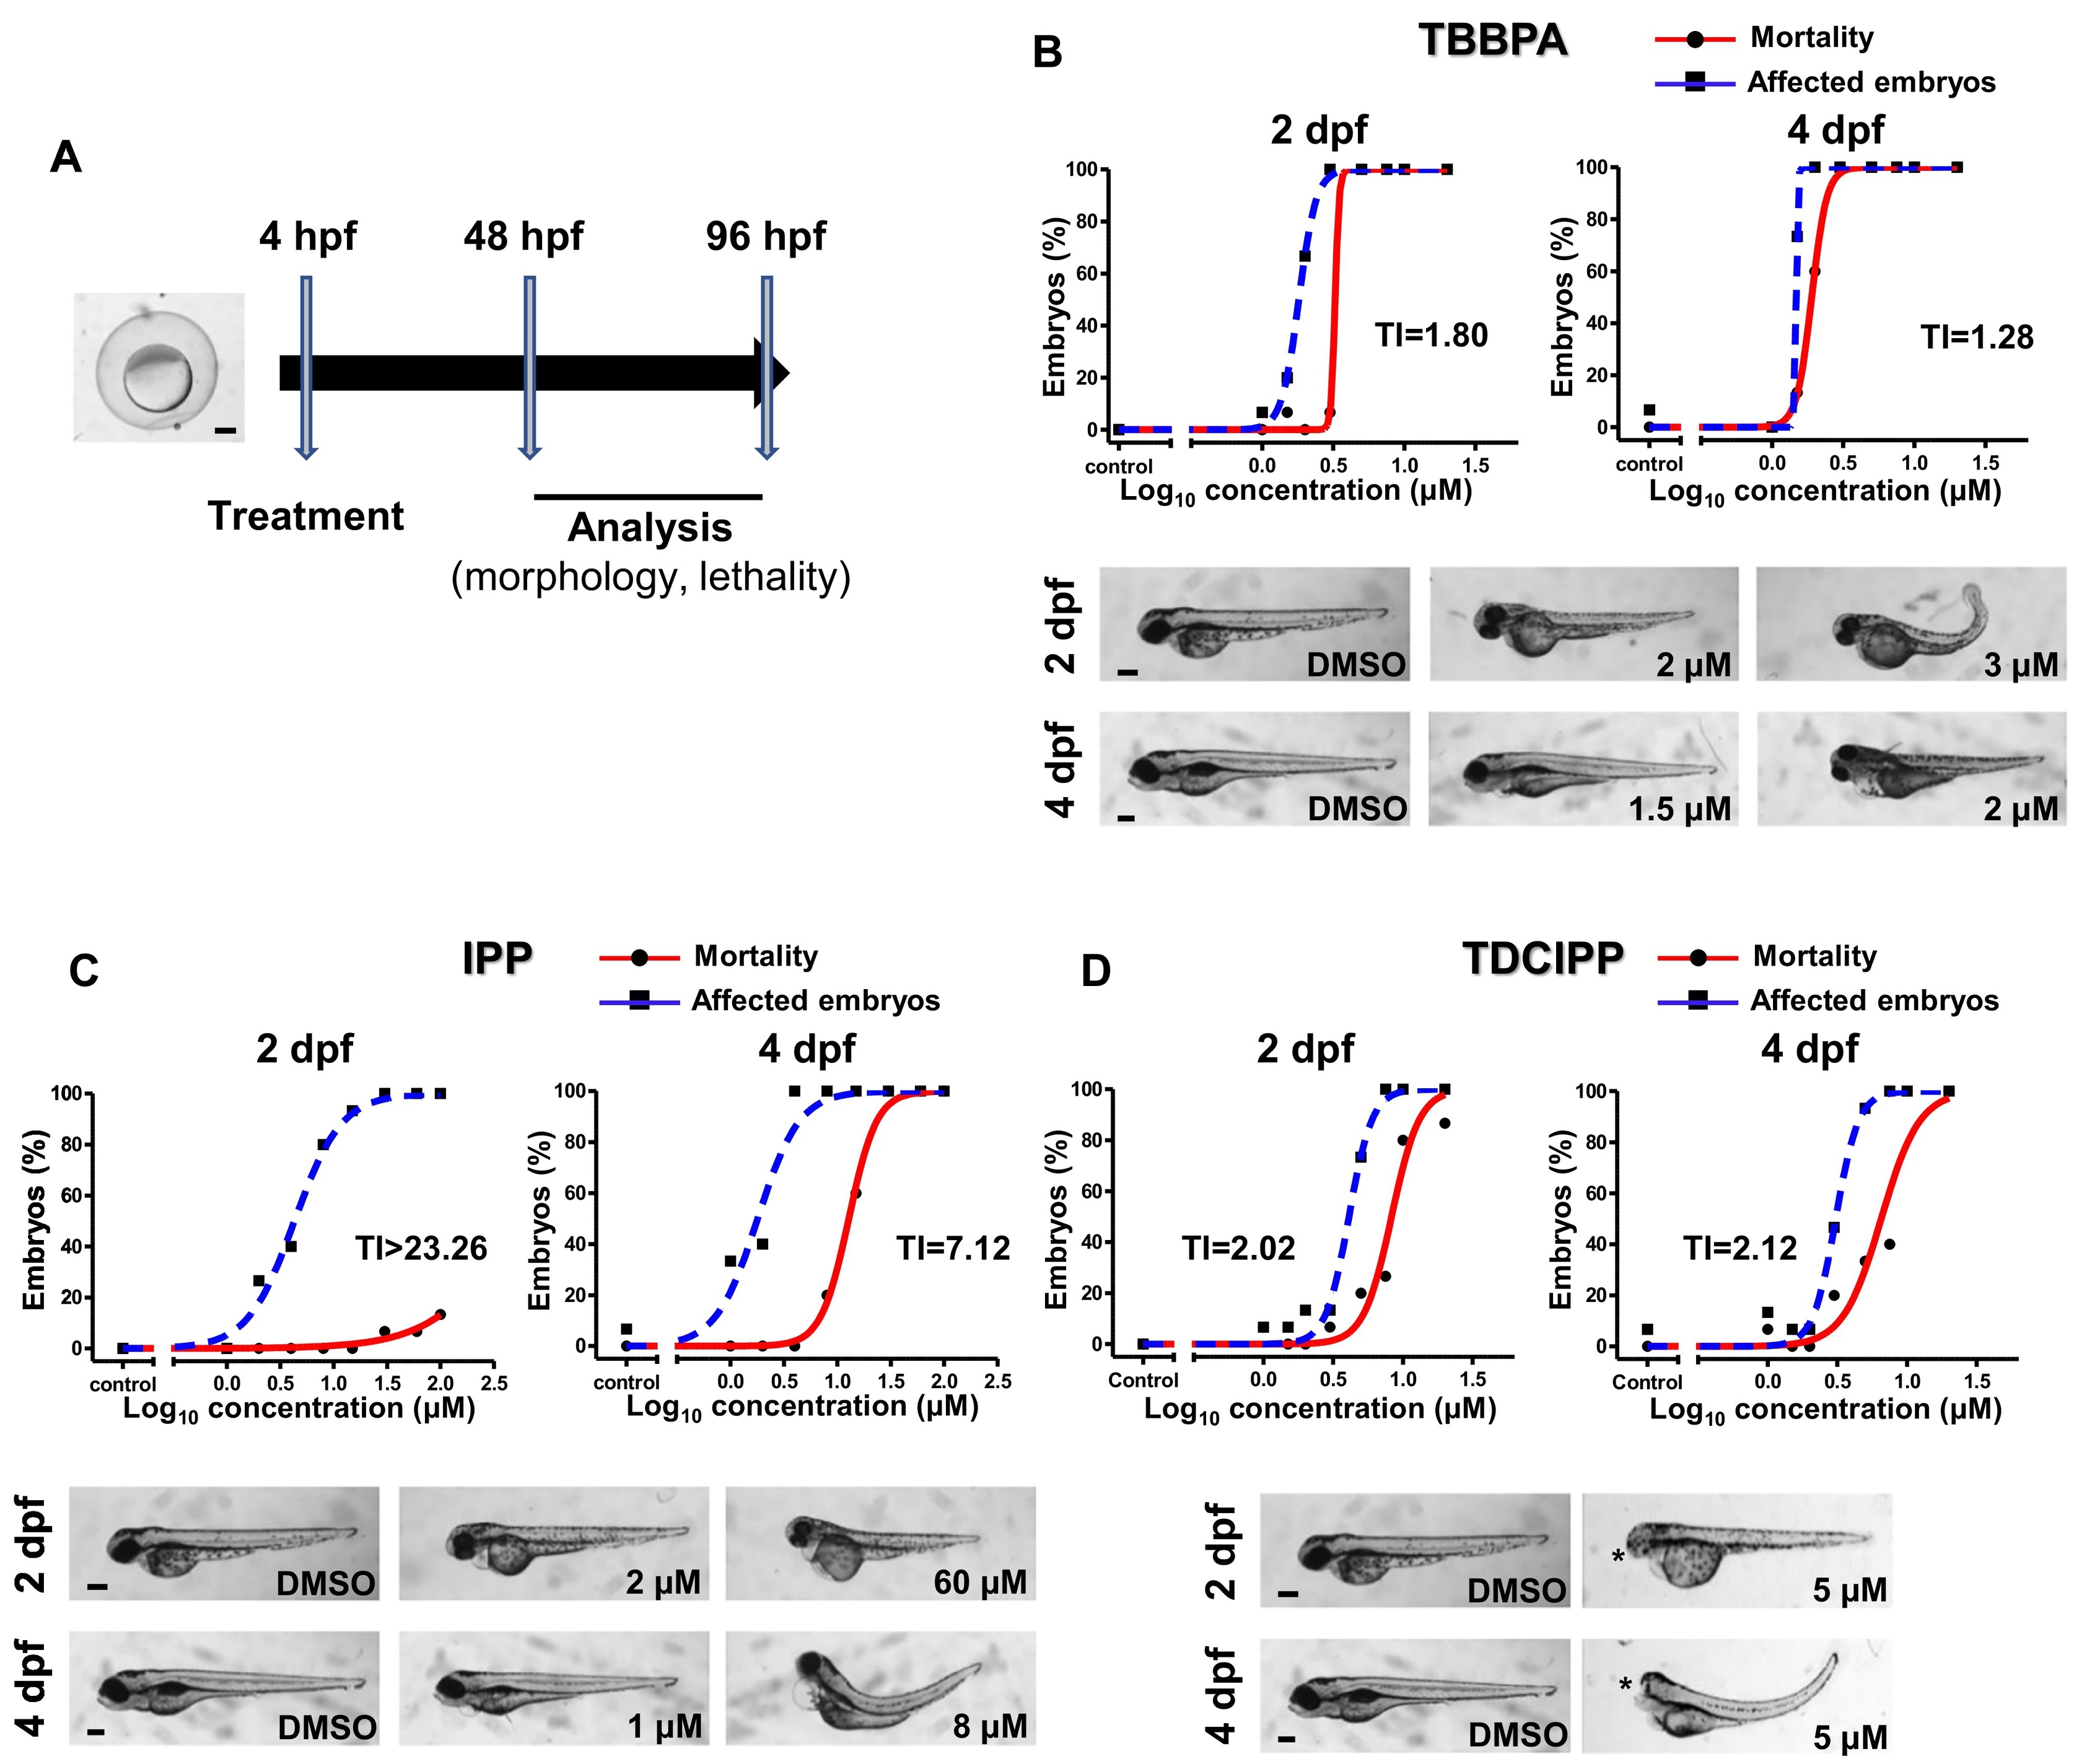
Fig. 1
Developmental Toxicity assay and examples of the results obtained for the some of the BFRs and OPFRs (Experiment 1). A) Schematic depicting a summary of the experimental design of developmental toxicity assay. B, C, D) Results obtained for the BFR TBBPA (B) and for the replacement OPFRs IPP (C) and TDCIPP (D). Sigmoidal dose-response curves were calculated at 2 and 4 dpf for the percentage of affected and dead embryos. TI values (LC50/EC50) are indicated. Representative bright field pictures of the embryos treated at the stages and concentrations indicated are also shown. Asterisks point to the absence of eyes. Scale bar, 200 μM in all pictures.