
|
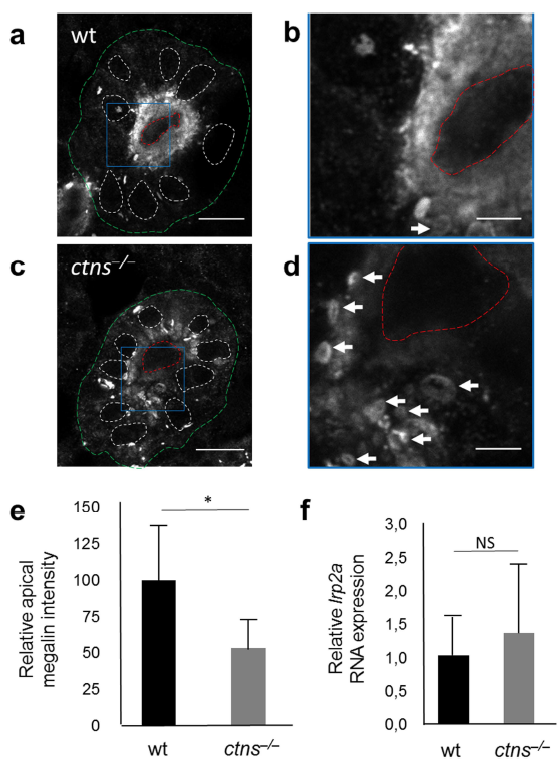
Fig. 7
(a) Transverse fluorescent image of the proximal pronephric region of wt 5 dpf larva labelled with anti-megalin antibody (bar = 10 μm). (b) Higher magnification image of wt proximal tubule (square in panel a) showing mainly the diffuse distribution of megalin at the cellular brush border (bar = 3 μm). (c) The proximal pronephric region of ctns−/− 5 dpf larva labelled with anti-megalin antibody (bar = 10 μm). (d) Higher magnification image of ctns−/− proximal tubule (square in panel c) showing majority of megalin staining in sub-apical intracytoplasmic vacuoles (white arrows) (bar = 3 μm). Outer boundaries of proximal tubules were delineated with green, lumen with red, and nuclear boundaries were delineated with white. (e) Quantitation of megalin protein abundance in proximal tubules of wt and ctns−/− larvae (N = 5 for each genotype). (f) Quantitation of the megalin encoding lrp2a RNA expression in homogenized larvae of 6 dpf wt vs ctns−/− larvae (N = 5 individually separated RNA samples for each genotype). *P < 0.05.