
|
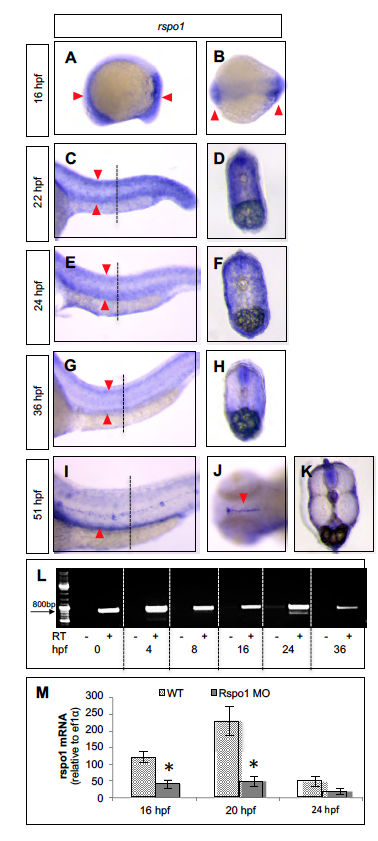
Fig. S1
R-spondin-1 (rspo1) expression. (A-K) Embryos fixed at the times indicated and processed by WISH for expression of rspo1 transcript. Lateral (A,C,E,G,I), dorsal (B,J) views or transverse sections (D,F,H,K) are presented, at 70X (A,B) or 160X (C-K) magnification. Black dotted lines indicate the level of transverse sections (C,E,G,I). Red arrowheads identify regions of more abundant rspo1 expression. Rspo1 was expressed in the neural tube and in the trunk mesoderm of embryos 22 hpf – 36 hpf (A-H). Rspo1 expression was limited to the lateral line (I), a cranial ventricular region (J), and an area ventral to the dorsal aorta (K) in 51 hpf embryos. (L) RT-PCR for rspo1 message in mRNA from whole embryos at the stages indicated. No reverse transcriptase (RT) control lanes are indicated (-). (M) Rspo1 mRNA levels (mean±SEM) relative to ef1 control quantified by q-RT-PCR from uninjected and Rspo1 MO injected animals. * = statistically significant (p ≤ 0.007) determined by one-way ANOVA