
|
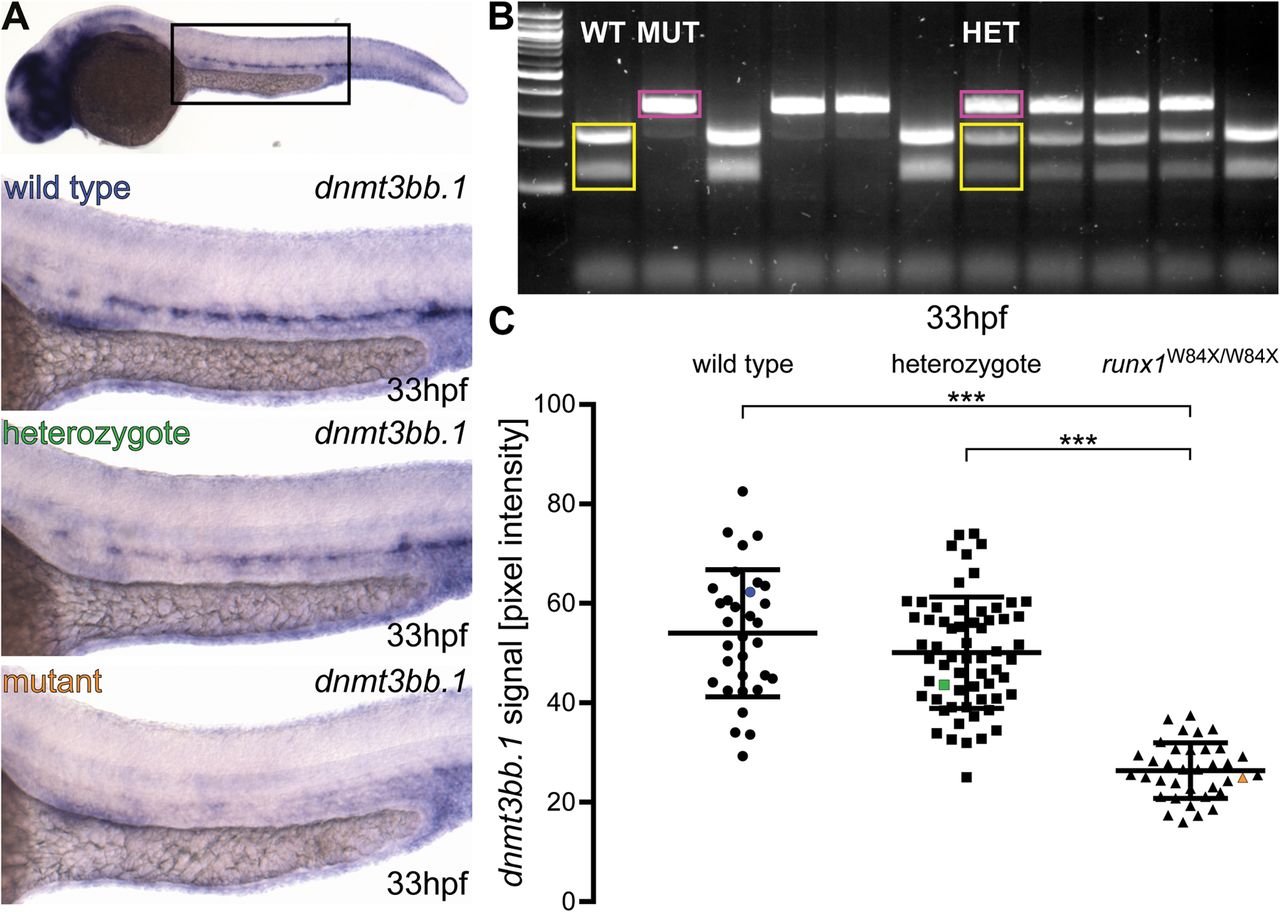
Fig. 2
Runx1 mutants have significantly reduced levels of dnmt3bb.1 mRNA detected by ISH. (A) Representative images of ISH for dnmt3bb.1 in 33 hpf wild-type (blue), runx1+/W84X (green) and runx1W84X/W84X (orange) embryos, showing the expression in the dorsal aorta. The top panel indicates the location of the zoomed regions in a wild-type embryo. (B) 2% agarose gel showing representative genotypes of wild-type (WT), heterozygous (HET) and mutant (MUT) runx1 embryos, distinguished by RFLP. Yellow: wild-type 214 bp+124 bp bands, pink: 338 bp mutant band. First lane from the left: 100 bp DNA ladder. (C) Pixel intensity values of dnmt3bb.1 mRNA in runx1W84X/W84X embryos (n=36) are significantly decreased compared to wild type (n=32) and heterozygotes (n=62) (ANOVA, P<0.001). The coefficients of variation are 24%, 22% and 21% for wild-type, heterozygote and mutant groups, respectively. Blue, green and orange data point correspond to the example images from panel A. The bars represent mean±s.d. ***P<0.001 (Games-Howell post-hoc test).