
|
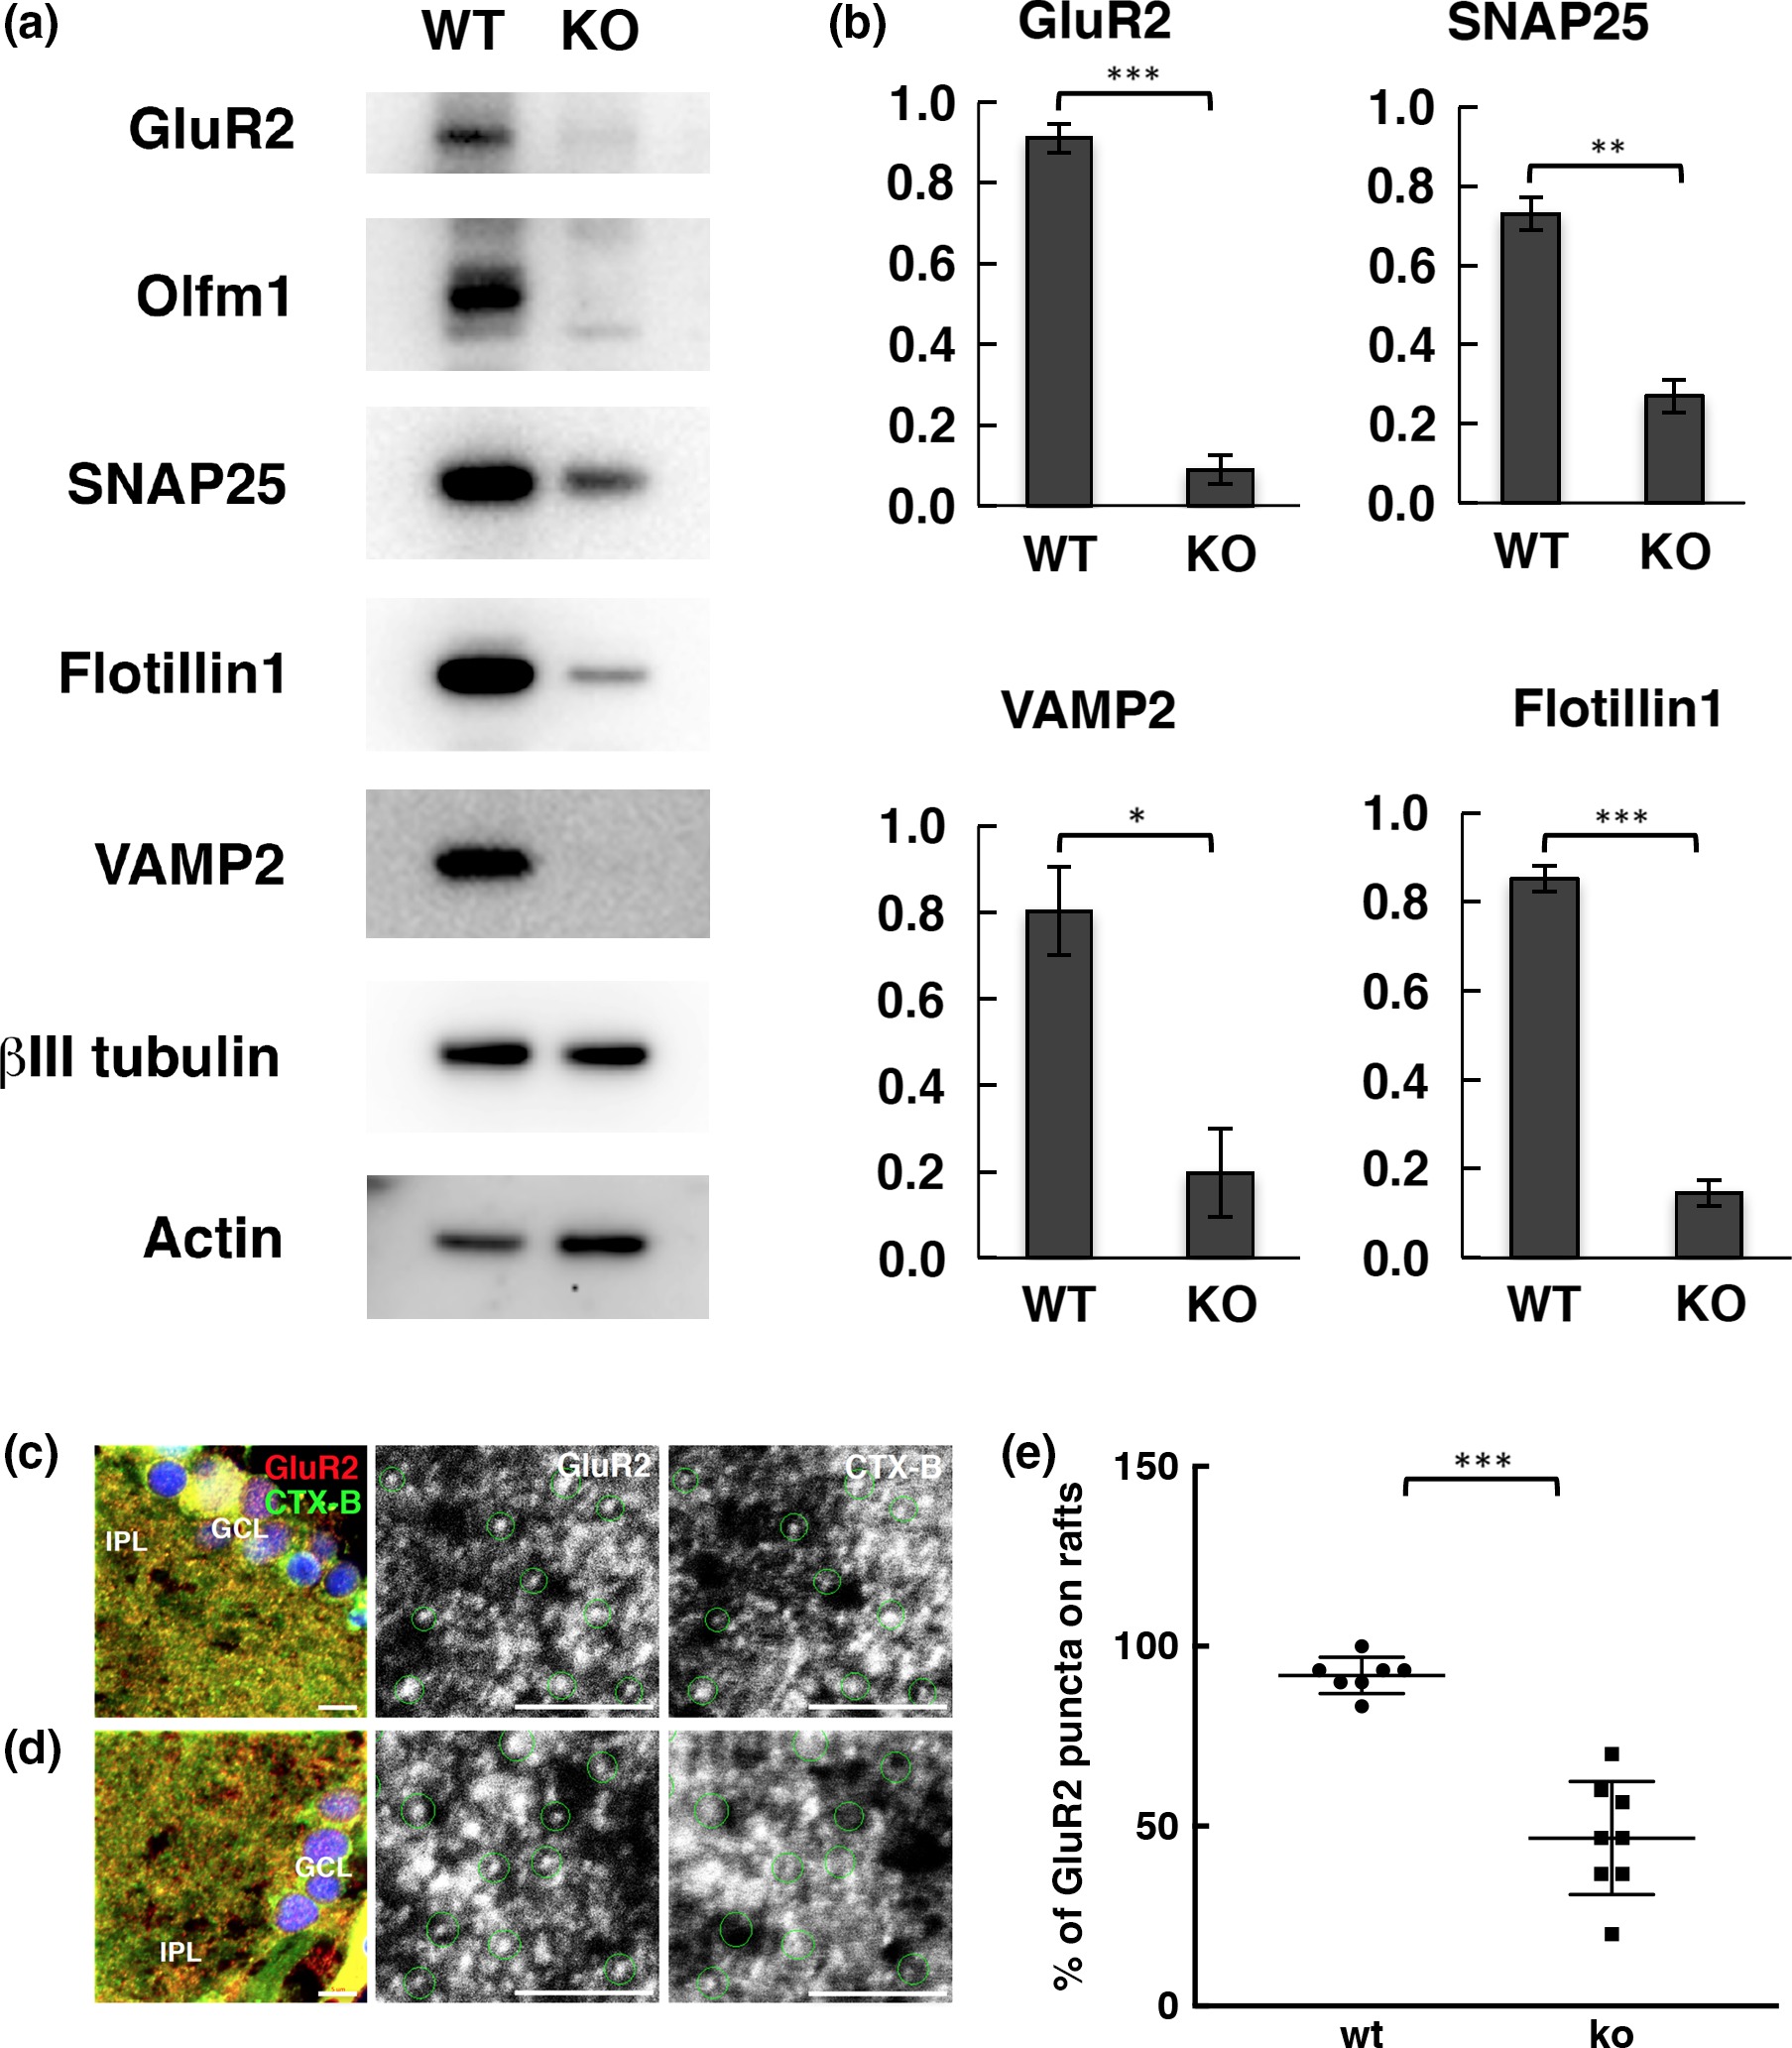
Fig. 4 Characterization of the microdomain fraction from wt and olfm1 null brain. (a) Changes in the protein levels detected in the microdomain fraction from wt and olfm1 null adult brain. (b) Quantification of the results of three independent experiments as in (a). (c, d) GluR2 localization in CTX‐B‐labeled lipid rafts in the IPL of adult wt (c) and olfm1 null (d) zebrafish retina. The black/white images in the middle and right rows represent enlarged images in each channel from the red squared areas in the left row. Note that all green‐circled GluR2‐positive puncta are localized in CTX‐B‐bound lipid rafts in wt retina, while some of GluR2 puncta in olfm1 null are not in lipid rafts. Scale bar, 5 μm. (e) Quantification of the results of seven wt and eight olfm1 null independent eye sections as in (c and d). *p < 0.05, **p < 0.01, ***p < 0.001.