
Image
|
Figure Caption
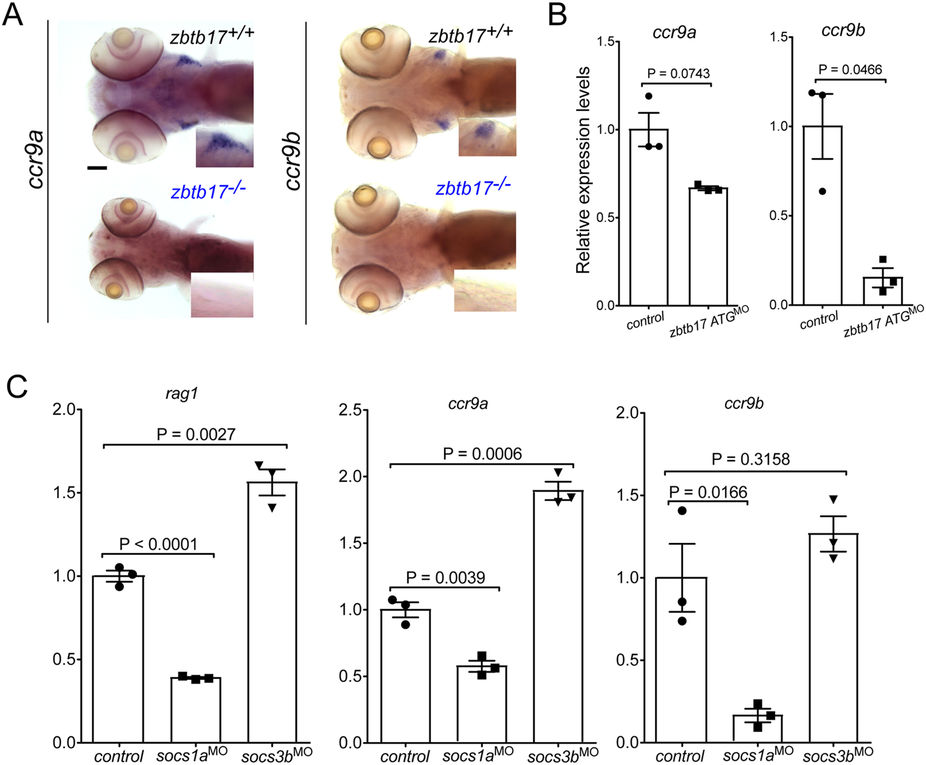
Fig. 5
Chemokine receptor expression.
(A) Representative microphotographs of wild-type and zbtb17 mutant embryos after RNA in situ hybridization with ccr9a and ccr9b gene-specific probes at 5 dpf. Insets represent 2× magnifications of the thymic regions. No signal is detectable in zbtb17 mutants. Scale bar, 100 μm. (B) Gene expression levels for ccr9a and ccr9b in zbtb17 ATG-morphants as assessed by qPCR. (C) Gene expression levels for rag1, ccr9a and ccr9b in socs1a and socs3b morphants as assessed by qPCR.
Figure Data
Acknowledgments
This image is the copyrighted work of the attributed author or publisher, and
ZFIN has permission only to display this image to its users.
Additional permissions should be obtained from the applicable author or publisher of the image.
Full text @ Sci. Rep.