
|
Fig. 3
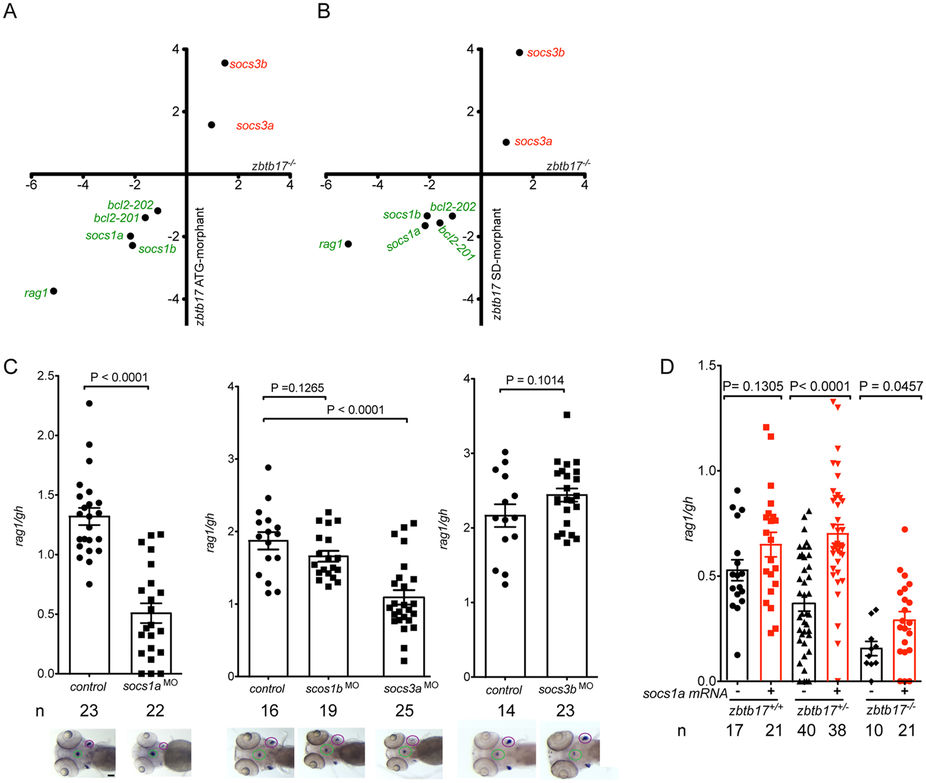
Functional consequences of the zbtb17 missense mutation.
(A) qPCR analysis of gene expression levels in homozygous zbtb17 mutants at 5 dpf compared to gene expression levels for zbtb17 ATG-morphants determined at 96 hpf. Expression levels were normalized to those of the actb1 gene and are expressed as fold changes relative to wild-type values; mean values (n = 3 or 4) are shown (detailed results are presented in Supplementary Fig. 1). (B) qPCR analysis of gene expression levels in homozygous zbtb17 mutants at 5 dpf compared to gene expression levels for zbtb17 SD-morphants determined at 96 hpf. Expression levels were normalized to those of the actb1 gene and are expressed as fold changes relative to wild-type values; mean values (n = 3 or 4) are shown (detailed results are presented in Supplementary Fig. 1). (C) Effect of socs gene knock-downs on thymopoietic activity expressed as rag1/gh ratios. Representative RNA in situ hybridization results (the thymic rudiments [marked by expression of rag1] are encircled in purple, the hypophysis [marked by expression of gh] is encircled in green) are shown underneath the relevant bar charts for which mean ± s.e.m. values are shown; each data-point represents one embryos (the total numbers of embryos for each column are indicated). Scale bar, 100 μm. (D) Rescue of the zbtb17 mutant phenotype by provision of socs1a mRNA. The extent of T cell development was assessed by rag1/gh ratios after RNA in situ hybridization without (black bars) and with (red bars) provision of in vitro transcribed socs1a mRNA (the total number of embryos for each column are indicated).