
|
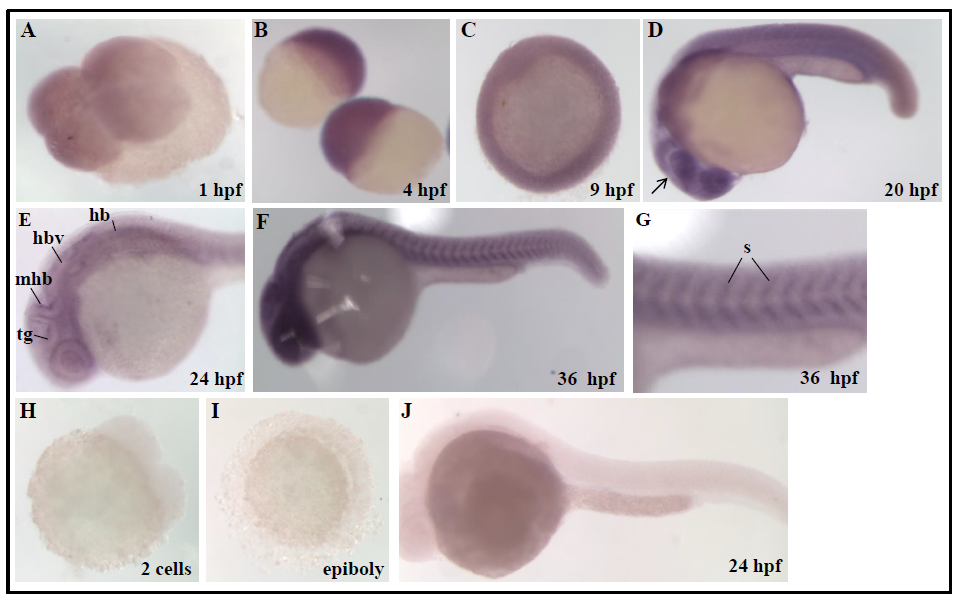
Fig. S2
Expression pattern of coasy transcript during zebrafish development
Spatiotemporal analysis of coasy expression by WISH using a coasy-specific probe. WISH was performed from 0.2 hpf (1-2 cells) to 36 hpf with a coasy-specific antisense probe. (A) Dorsal view, four cells stage; (B) lateral view, sphere stage; (C) dorsal view, germ ring. (D-G) 20, 24, 36 hpf lateral views; (G) 36 hpf lateral view, magnification of somites. For each stage, at least 30 embryos were analyzed in two independent experiments. mhb, midbrain-hindbrain boundary; h, hindbrain; hbv, hindbrain ventricle; tg, tegmentum; s, somites. A digoxigenin-labelled, coasy sense probe was synthezised as described in Material and Methods and applied for in situ hybridization with embryos at different developmental stages (H-J). No specific labelling was evident at any stage. Rapresentative images from one experiment performed with at least 30 embryos and repeated twice.