
|
Fig. 7
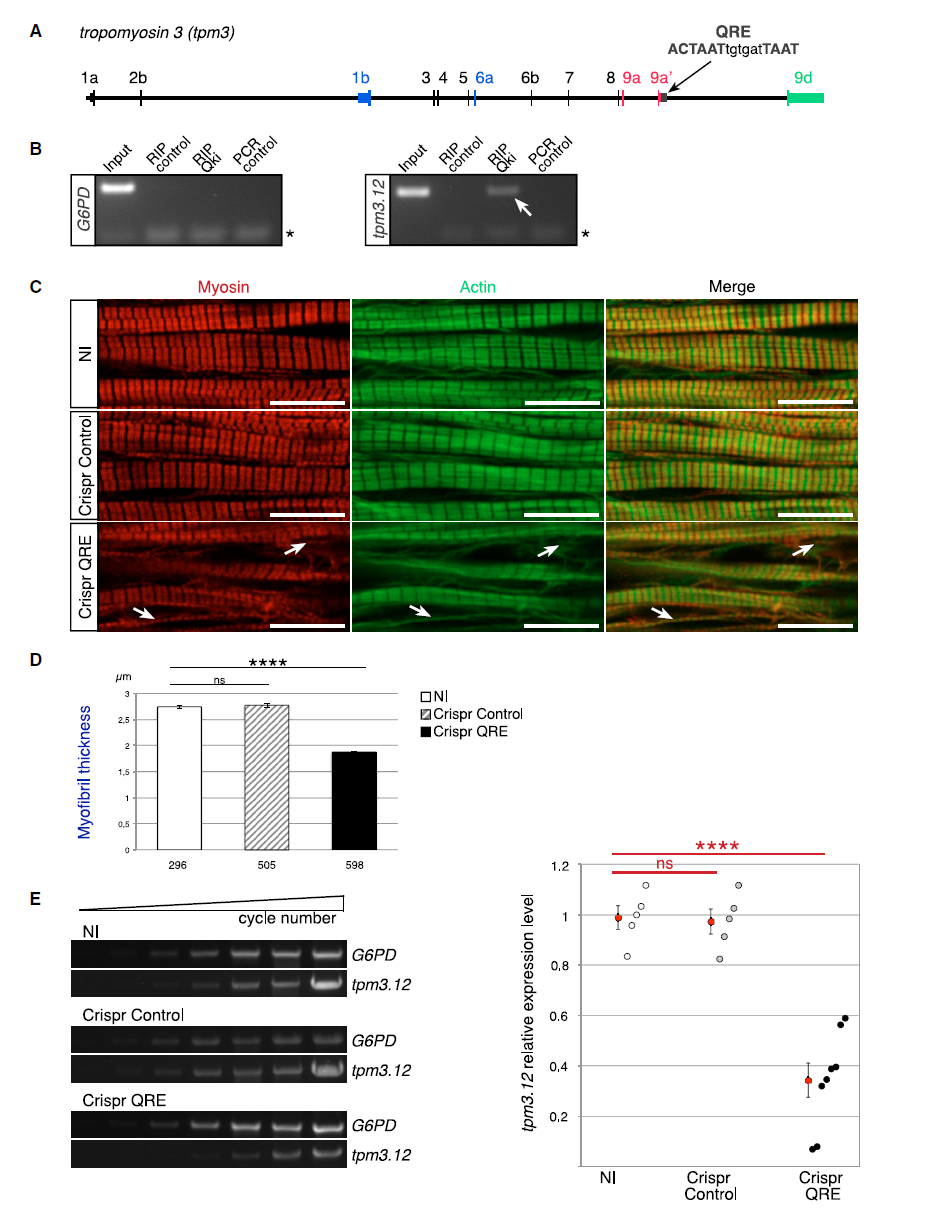
The Quaking-Binding Site Located in the 3′ UTR of tpm3.12 Transcript Is Required for Myofibril Formation and Accumulation of tpm3.12 Transcripts
(A) Schematic of the tpm3 gene indicating the position and sequence of the Qki-binding site in exons (QRE, bold). Exon numbers are indicated above the transcript. Specific exons are colored as in Figure 4.
(B) Qki proteins physically interact with tpm3.12 mRNA in 17-hpf zebrafish embryos. tpm3.12 mRNA was detected following RNA immunoprecipitation with Qki antibody (arrow), but not with control antibody. G6PD is used as a control mRNA. Position of PCR primers is indicated by asterisks.
(C) Mutations in the QRE located in the 3′ UTR of tpm3.12 transcript lead to myofibril defects at 26 hpf. Confocal imaging of myosin (red) and actin (green) immunostained 26-hpf zebrafish embryos (lateral view from single optical sections). Injection of CRISPR Control RNA (n = 8) into zebrafish embryos does not affect myofibril formation compared with non-injected (NI) embryos (n = 8), whereas injection of CRISPR RNA targeting tpm3.12 QRE (n = 15) leads to myofibrils with splitting defects (arrows). In all panels, anterior is to the left. Scale bars, 10 μm.
(D) Quantification of the myofibril phenotype illustrated in (B). NI embryos (n = 4) and embryos injected with CRISPR control (n = 6) display myofibrils of similar thickness (Student's t test, p = 0.5), whereas embryos injected with CRISPR QRE (n = 6) have significantly thinner myofibrils (Student's t test, p = 2 × 10−55). Numbers under the graph indicate the total number of quantified myofibrils.
(E) tpm3.12 transcript level is reduced in embryos with mutated QRE at 26 hpf. tpm3.12 expression was assessed using semi-quantitative RT-PCR in single embryo (NI, injected with CRISPR control RNA or CRISPR RNA targeting tpm3.12 QRE). For each single embryo, PCR products were taken from successive PCR cycles and resolved by electrophoresis (left panel). tpm3.12 expression level was quantified and normalized to G6PD (right panel). Each dot represents a single embryo. For each condition, the mean of single embryos is indicated by a red dot, on the left of the dot group. Student's t test, p = 8.77 × 10⁻⁶.
Pooled data are presented as mean ± SEM. ∗∗∗∗p < 1 × 10⁻⁴. ns, not significant. See also Figure S6.
Reprinted from Developmental Cell, 42(5), Bonnet, A., Lambert, G., Ernest, S., Dutrieux, F.X., Coulpier, F., Lemoine, S., Lobbardi, R., Rosa, F.M., Quaking RNA-Binding Proteins Control Early Myofibril Formation by Modulating Tropomyosin, 527-541.e4, Copyright (2017) with permission from Elsevier. Full text @ Dev. Cell