
|
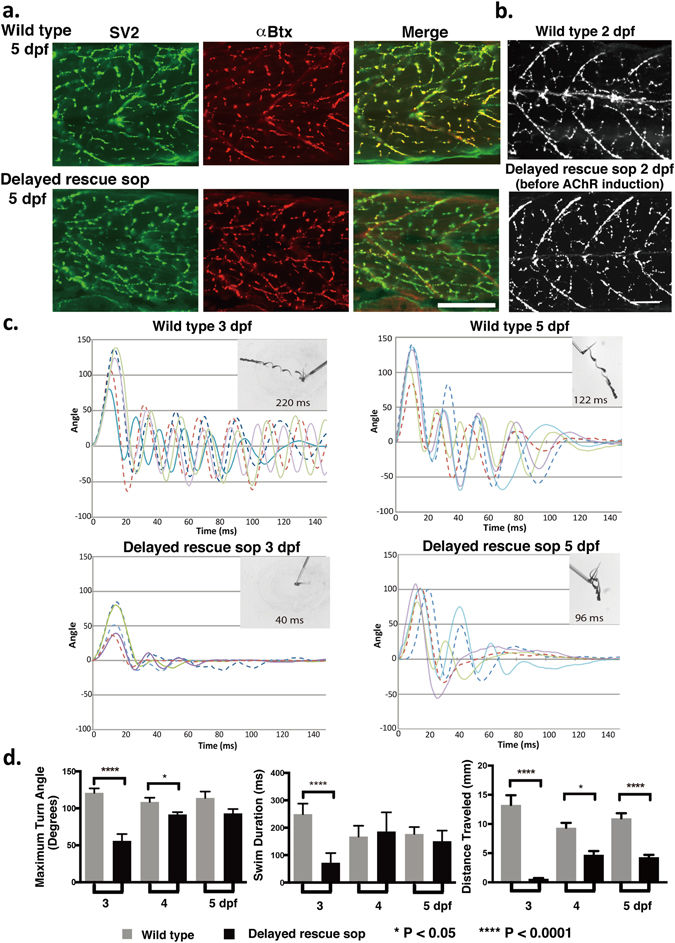
Fig. 2
Locomotion of delayed rescue sop. (a) Nerve terminals visualized by anti-SV2 antibody that overlap with the postsynaptic AChRs visualized by αBTX, in wild type and delayed rescued sop embryos at 5 dpf. Scale bar, 50 µm. (b) anti-SV2 antibody staining at 2 dpf, in wild type and in delayed rescue sop before AChR induction. (c) Escape behaviors in wild type and delayed rescue sop at 3 and 5 dpf in response to tactile stimuli. Kinematics for representative traces of 5 larvae are shown for the initial 150 ms of response. Each trace represents a different larva. Body angles are shown in degrees with 0 indicating a straight body, and positive and negative values indicating body bends in opposite directions. Inlaid images of representative larva for each group show superimposed frames of complete escape response and indicate the duration of movement in ms. (d) Maximum turn angle, swim duration and distance traveled were calculated for each group of fish (n = 10 per group) at 3, 4, and 5 dpf. Maximum turn angle is defined as the strongest body angle the larva makes in its initial turn (C-bend) away from the stimulus. Swim duration is defined as the length of time the larva swims following the stimulus until returning to a resting state. Distance traveled is defined as the distance between locations of the head at the start and the end of the swimming.