
|
Fig. S2
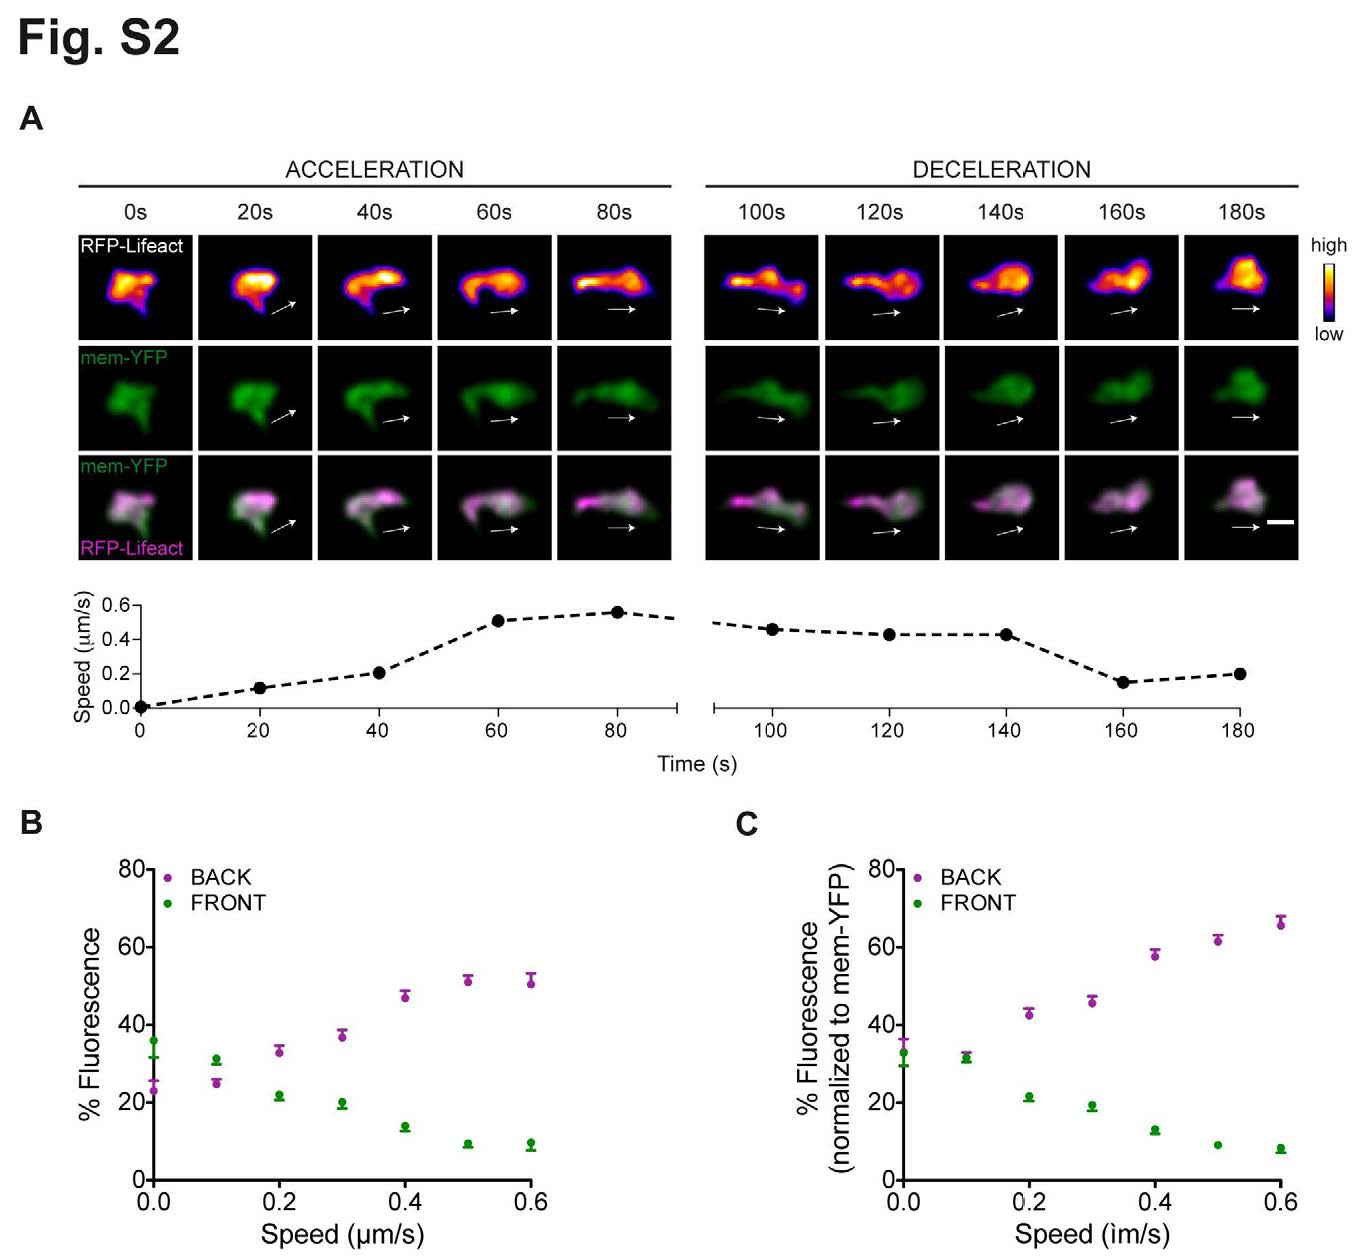
F-actin anteroposterior polarity in live myeloid cells correlates with cell speed, related to Fig. 2. (A) Top panel, one cycle of front-rear F-actin waves is visualized in wounded TG(FmpoP::memYFP) larvae co-expressing transiently RFP-Lifeact and PKC-ζ-WT in myeloid cells. Shown are frames taken at the indicated times from representative movies of migrating leukocytes in the wounded tailfin. The white arrows indicate direction of migration. Scale bar = 10 μm. Bottom panel, time profile of cell’s speed. Black dots correspond to the indicated time points. (B) Fluorescence signal distribution of F-actin in “back” and “front” regions of the cell at each time point ti is plotted against cellular speed (determined using the positions at ti-1 and ti+1 as described in the Materials and Methods). For each range of speed, data represents means ± s.e.m. (521 counts, 16 leukocytes from 3 larvae; Back: Spearman r = 0.61, Front: Spearman r = - 0.57, **** p (two-tailed) < 0.0001). (C) Fluorescence signal distribution in (B) is normalized to memYFP intensity levels and plotted against cellular speed. For each range of speed, data represents means ± s.e.m. (Back: Spearman r = 0.69, Front: Spearman r = -0.67, **** p (two41 tailed) < 0.0001).