
|
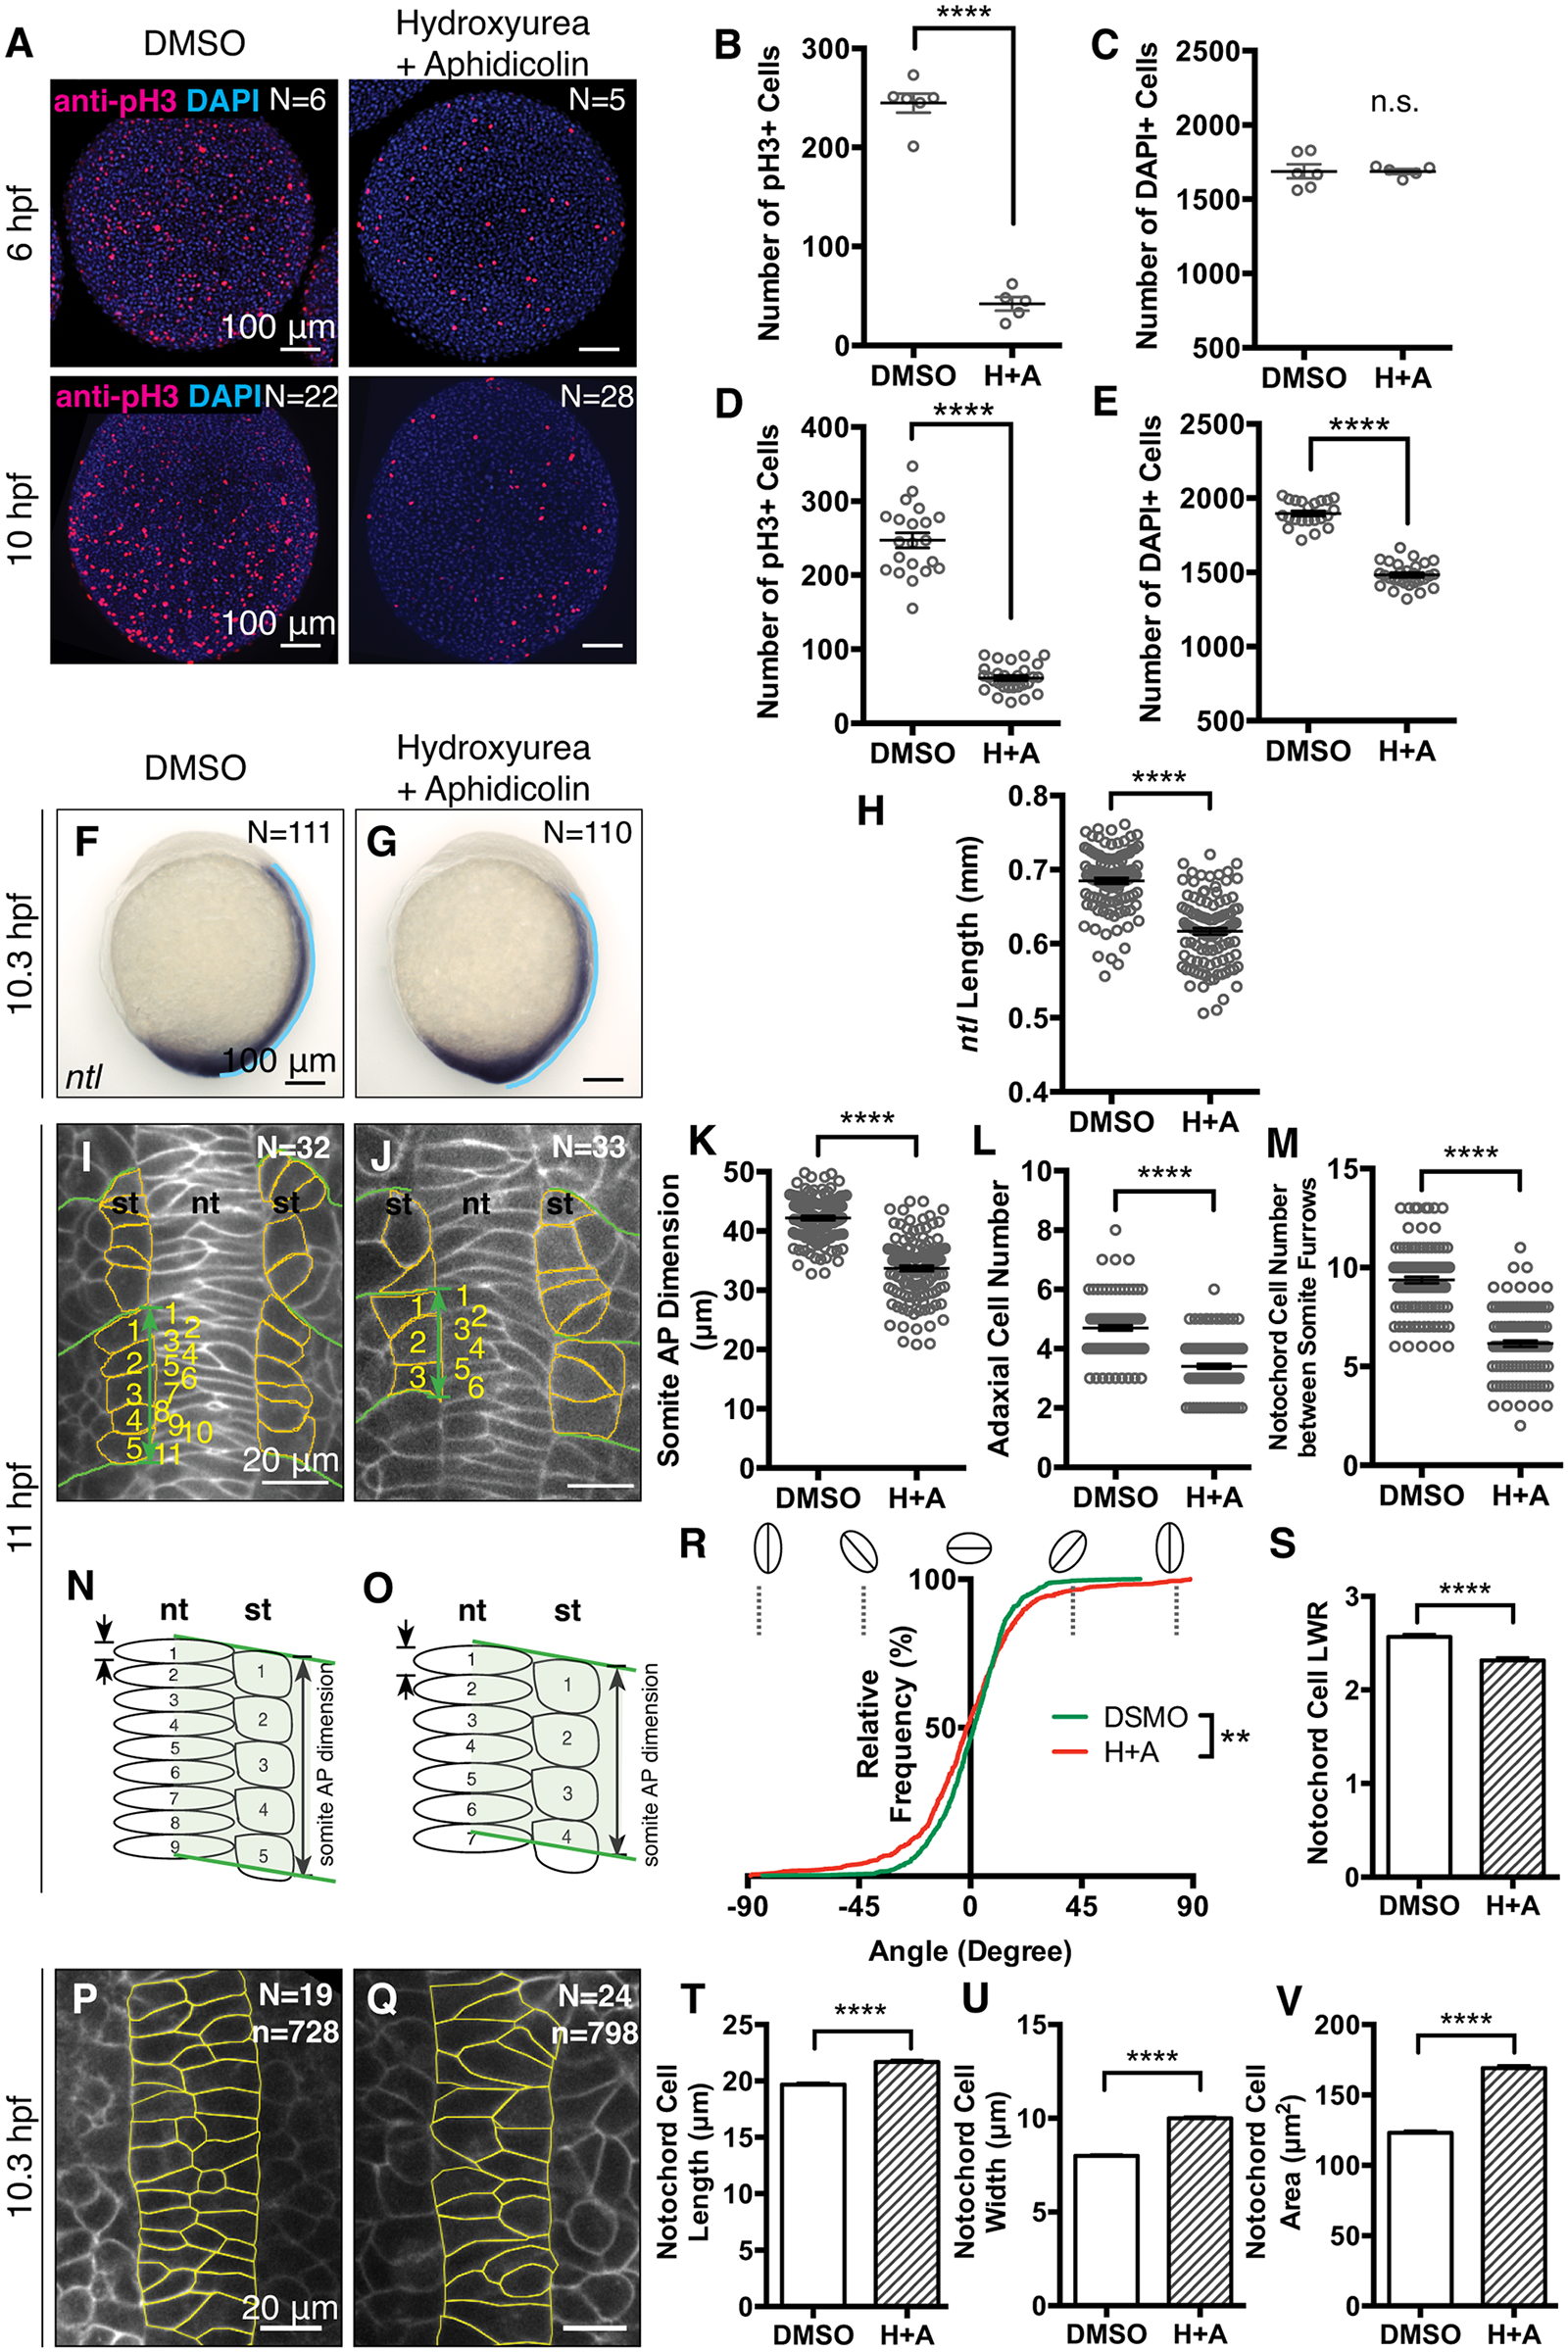
Fig. 8
Inhibition of cell proliferation using hydroxyurea and aphidicolin leads to axis extension defects in zebrafish gastrulae.
(A) Immunofluorescent anti-pH3 labeling of proliferating cells (red) and total nuclei labeled with DAPI labeling (blue) in DMSO-treated control embryos and hydroxyurea+aphidicolin (H+A)-treated embryos at 6 hpf (animal view) and 10 hpf (dorsal view, anterior to the top). (B-E) Quantification of pH3+ cells (B and D) and DAPI+ cells (C and E) in A. (F and G) Expression of ntl at 1-somite stage (lateral view, anterior to the top). (H) Quantification of notochord length (blue lines in F and G). (I and J) Confocal image of dorsal mesoderm in 3-somite stage embryos expressing mGFP with somite AP dimension illustrated with green arrow, somitic boundaries outlined in green, adaxial cells outlined in orange, adaxial cells and notochord cells between adjacent somitic boundaries numbered in yellow (dorsal view, anterior to the top). (K-M) Quantification of somite AP dimension (K), numbers of adaxial cells (L) and notochord cells (M) in I and J. (N and O) Schema of AP extension of the notochord and presomitic mesoderm. st, somite; nt, notochord. (P-V) Dorsal view showing cells labeled with mGFP in DMSO-treated (P) and drug-treated (Q) embryos at 1-somite stage (anterior to the top). Analyses of notochord cells’ orientation (R), shape (S), long axis (length, T), short axis (width, U) and size (V). ****p<0.0001, n.s. = non-significant, error bars = SEM.