
|
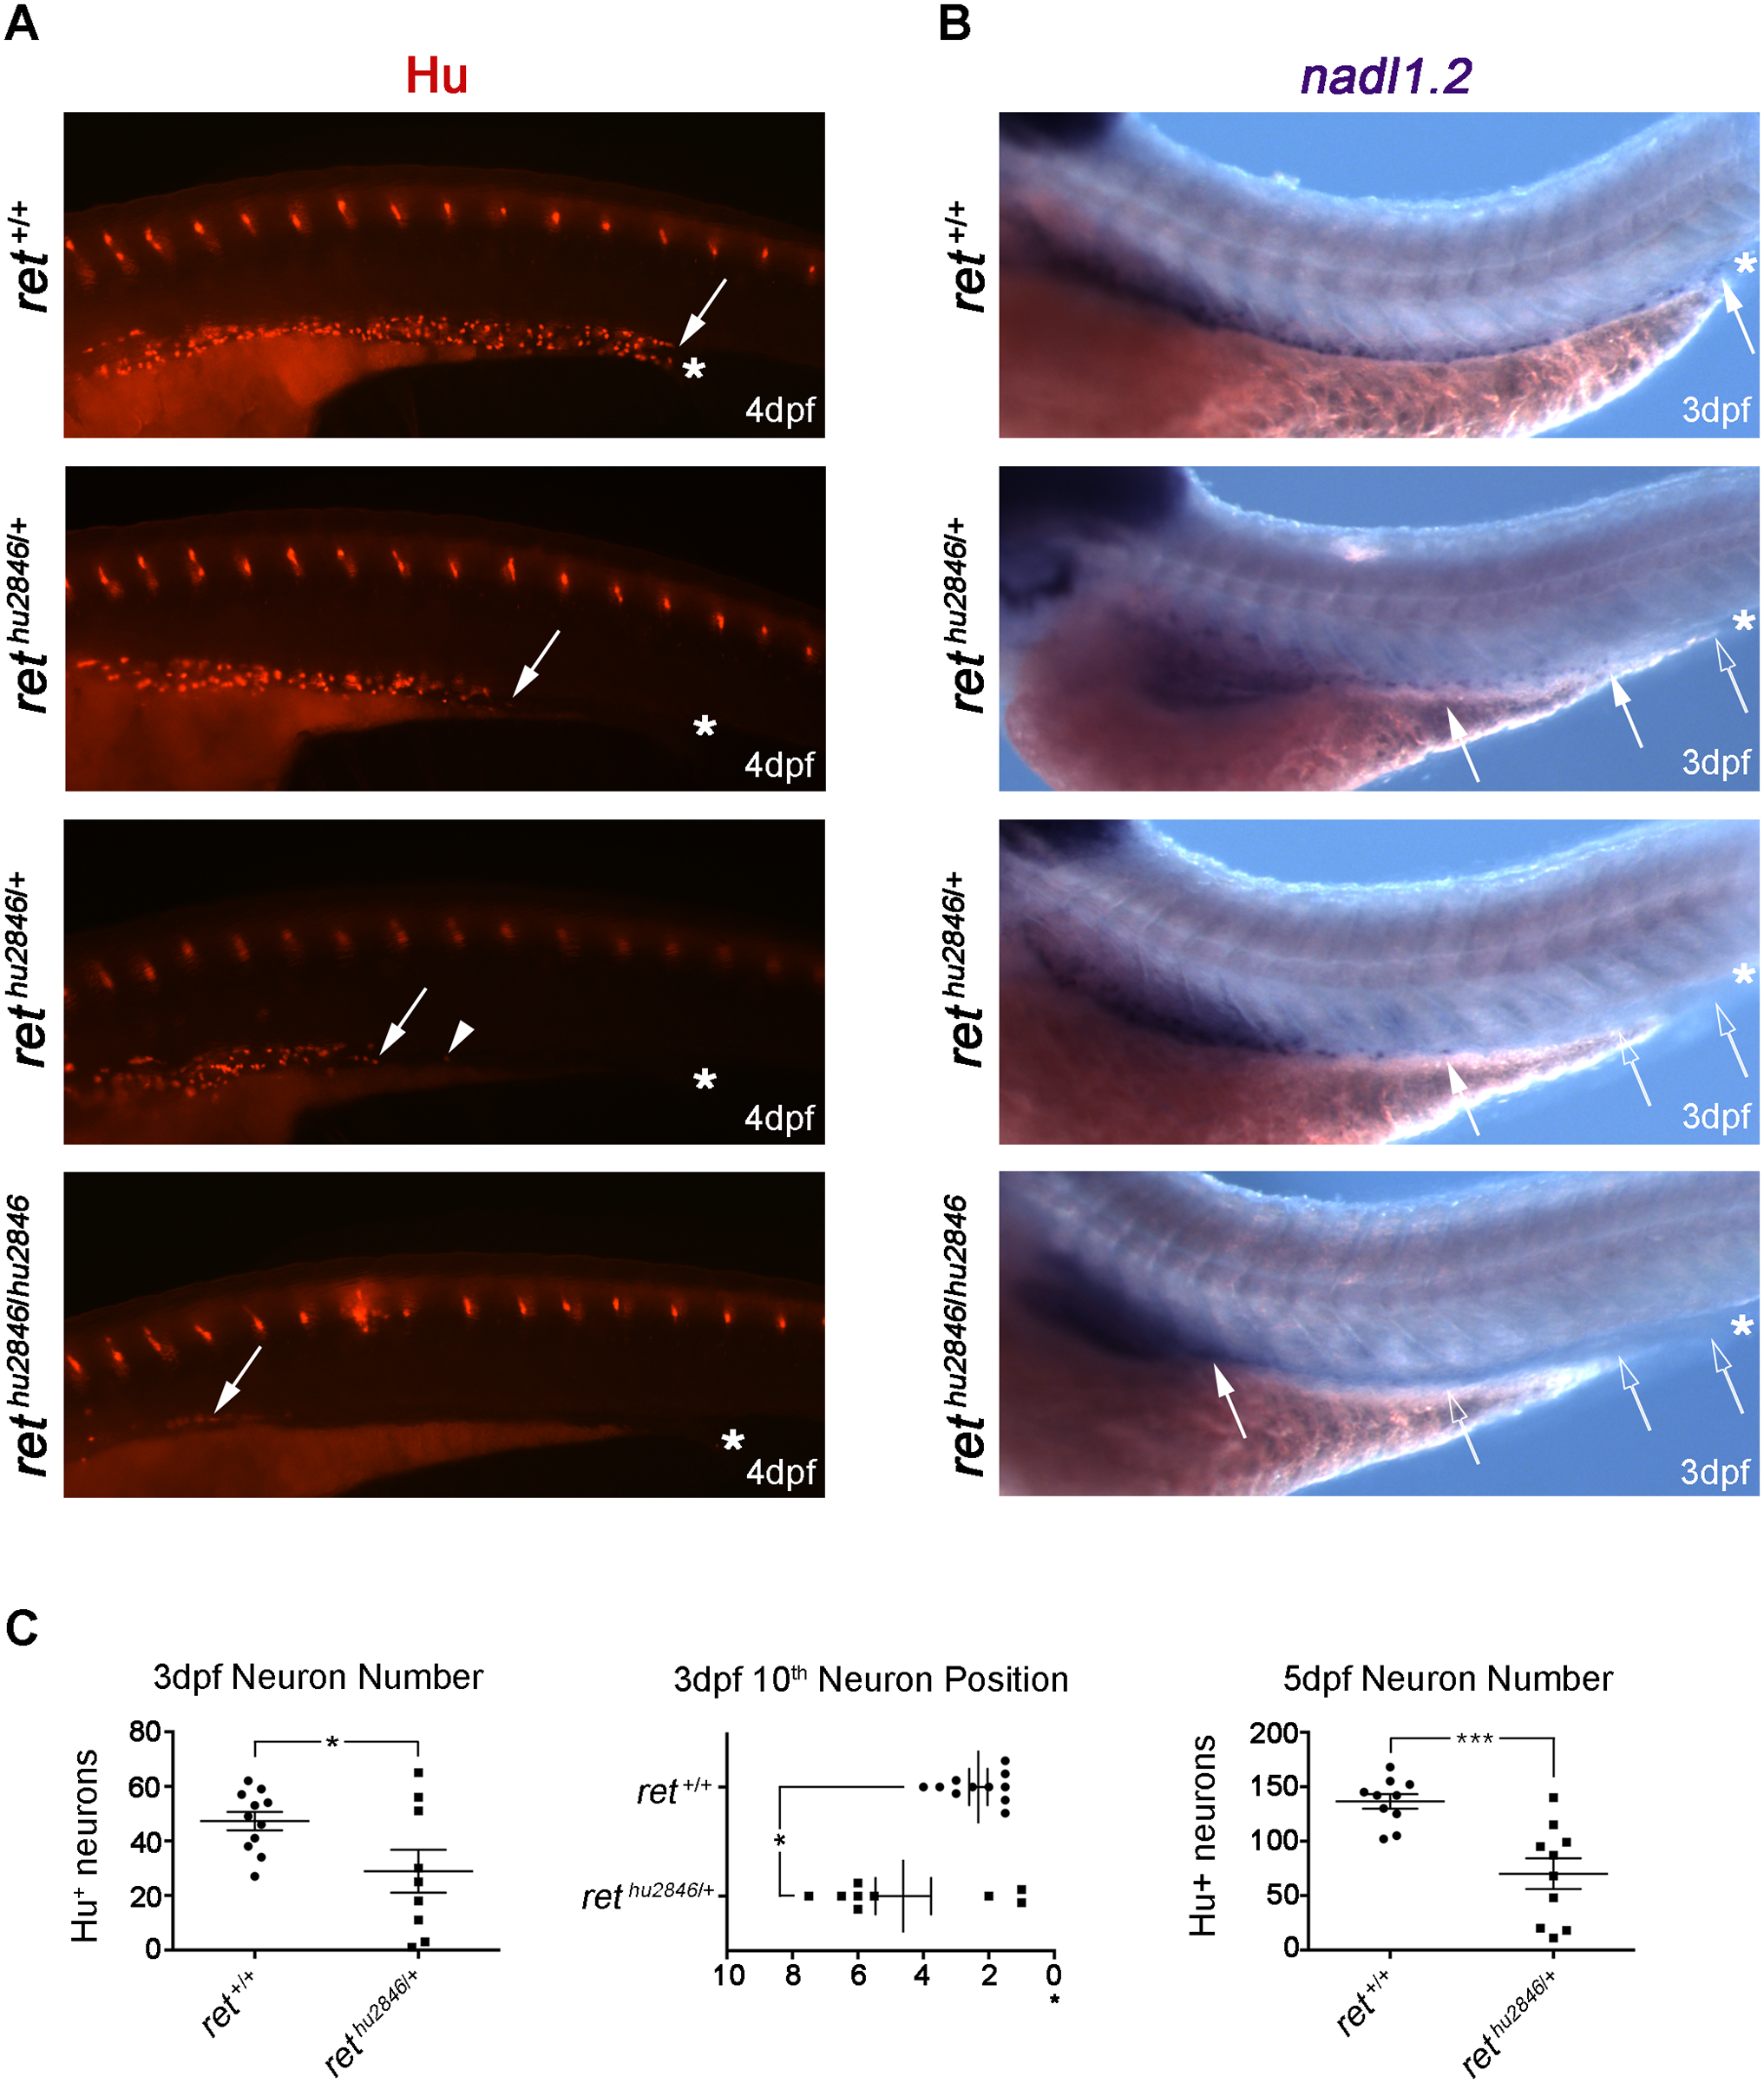
Fig. 1
Loss of ret leads to dose-dependent reduction of ENS progenitors and neurons.
(A-B) WT (ret+/+), rethu2846/+, and rethu2846/2846 larvae immunostained at 4dpf with HuC/D antibody to visualize enteric neurons (A) and processed at 3dpf by RNA in situ hybridization to detect nadl1.2 expressing ENCCs (B). Asterisks indicate end of gut tube (anal pore), filled arrows and arrowheads denote position of last HuC/D+ neuron or nadl1.2+ ENCCs, and open arrows denote gut areas lacking nadl1.2+ ENCCs. (C) Number of HuC/D+ neurons in the distal gut was significantly reduced relative to WT counterparts, at 3dpf (WT: 47±3, rethu2846/+: 29±8, p = 0.0281) and 5dpf (WT: 137±7, rethu2846/+: 70±14, p = 0.0009). However, rethu2846/+ larvae had a phenotypic range: some rethu2846/+ larvae showed neuron numbers equivalent to WT, and other rethu2846/+ larvae showed comparably fewer neurons than WT. Position of the 10th most distal enteric neuron was also significantly altered in rethu2846/+ larvae. Y-axis indicates somite lengths from end of the gut (*) (in rethu2846/+ larvae 4.6±0.8 somite lengths from the end of the gut vs. 2.3±0.3 in WT, p = 0.012). Again, rethu2846/+ larvae display a phenotypic range.